Although US stimulus deadlock is still far from breaking, gold prices stay above $1,900, currently down 0.07% to $1,929, while heading into the European open on Monday.
With the US Treasuries off from trading, due to the Columbus Day holiday, commodities couldn’t react to the weekend challenges to American President Donald Trump’s coronavirus (COVID-19) aid package. Although the Republican leaders’ readiness to offer $1.8 trillion propelled markets on Friday, House Speaker Nancy Pelosi’s rejection suggests no more money is going to flow through the Congress before the US presidential election.
Even so, the risk-on sentiment gains mildly optimism from Asia as the Chinese central bank reused FX trading routes to ease the strong domestic currency. Also favoring the market mood could be Australia’s easing of travel restrictions.
On the contrary, Brexit and COVID-19 woes in Europe raise bars for the risk-takers, which in turn challenge the gold prices’ further upside.
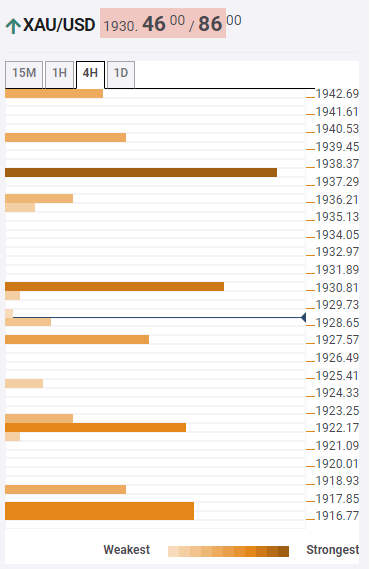
Key levels to watch
The previous highs on the hourly (H1), four-hour (4H) and 1-day (D1) chart highlight $1,931 as the immediate upside barrier holding the keys for the metal’s run-up towards $1,939 resistance including 61.8% Fibonacci retracement of the monthly move.
It’s worth mentioning that the 50-day SMA on the daily chart, around $1,940, adds to the upside barriers for the yellow metal bulls ahead of propelling gold buyers towards the mid-September tops near $1,973.
Meanwhile, the previous low on the 4H and 23.6% Fibonacci retracement of D1 near $1,922 can entertain sellers if the adjacent rest-point close to $1,928 breaks, comprising the middle Bollinger and SMA 50 on the 15-minutes chart.
In a case where the bears dominate past-$1,922, the 23.6% Fibonacci retracement of weekly moves and SMA 10 on 4H will challenge the further downside around $1,918 and $1,916.50.
Here is how it looks on the tool
About Confluence Detector
The TCI (Technical Confluences Indicator) is a tool to locate and point out those price levels where there is a congestion of indicators, moving averages, Fibonacci levels, Pivot Points, etc. Knowing where these congestion points are located is very useful for the trader, and can be used as a basis for different strategies.
Learn more about Technical Confluence
Information on these pages contains forward-looking statements that involve risks and uncertainties. Markets and instruments profiled on this page are for informational purposes only and should not in any way come across as a recommendation to buy or sell in these assets. You should do your own thorough research before making any investment decisions. FXStreet does not in any way guarantee that this information is free from mistakes, errors, or material misstatements. It also does not guarantee that this information is of a timely nature. Investing in Open Markets involves a great deal of risk, including the loss of all or a portion of your investment, as well as emotional distress. All risks, losses and costs associated with investing, including total loss of principal, are your responsibility. The views and opinions expressed in this article are those of the authors and do not necessarily reflect the official policy or position of FXStreet nor its advertisers. The author will not be held responsible for information that is found at the end of links posted on this page.
If not otherwise explicitly mentioned in the body of the article, at the time of writing, the author has no position in any stock mentioned in this article and no business relationship with any company mentioned. The author has not received compensation for writing this article, other than from FXStreet.
FXStreet and the author do not provide personalized recommendations. The author makes no representations as to the accuracy, completeness, or suitability of this information. FXStreet and the author will not be liable for any errors, omissions or any losses, injuries or damages arising from this information and its display or use. Errors and omissions excepted.
The author and FXStreet are not registered investment advisors and nothing in this article is intended to be investment advice.
Recommended content
Editors’ Picks
AUD/USD holds above 0.6500 in thin trading
The Australian Dollar managed to recover ground against its American rival after AUD/USD fell to 0.6484. The upbeat tone of Wall Street underpinned the Aussie despite broad US Dollar strength and tepid Australian data.
EUR/USD comfortable below 1.0800 lower lows at sight
The EUR/USD pair lost ground on Thursday and settled near a fresh March low of 1.0774. Strong US data and hawkish Fed speakers comments lead the way ahead of the release of the US PCE Price Index on Friday.
Gold pulls away from daily highs, holds above $2,200
Gold retreats from daily highs but holds comfortably above $2,200 in the American session on Thursday. The benchmark 10-year US Treasury bond yield stays near 4.2% after upbeat US data and makes it difficult for XAU/USD to gather further bullish momentum.
Google starts indexing Bitcoin addresses
Bitcoin address data is live on Google search results after users realized on Thursday that the tech giant started indexing Bitcoin blockchain data. However, mixed reactions have followed the tech giant's reversed stance on the cryptocurrency.
A Hollywood ending for fourth quarter GDP
The latest revisions put Q4 GDP at 3.4%, the second fastest quarterly growth rate in two years. Much of the upside was attributable to stronger consumer spending, yet fresh profits data affirmed it was a good quarter for the bottom line as well with profits up by the most since the Q2-2022.