Gold Price Analysis: XAU/USD bears hopeful below $1891 amid US election caution – Confluence Detector

The fate of gold (XAU/USD) hinges on the much-awaited outcome of the US Presidential election, which will determine the extent of the fiscal stimulus aid, as the country battles an intensifying second wave of the coronavirus.
A sweeping Blue-wave victory could likely be the best bet for the gold buyers. However. a contested outcome would reinforce the bearish momentum in the yellow metal. Therefore, a sense of caution will likely prevail in the markets in the lead up to the US election, underpinning the safe-haven dollar while keeping the upside attempts limited in gold. How is gold positioned technically?
Gold: Key resistances and supports
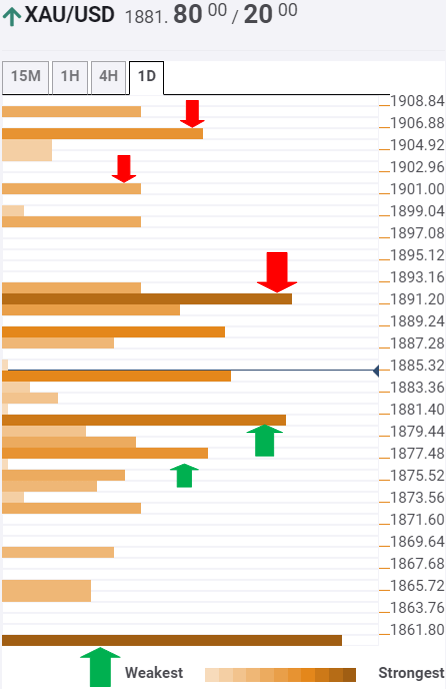
The Technical Confluences Indicator shows that the yellow metal could face an immediate hurdle at $1888 on its road to recovery, which is the confluence of the SMA100 one-hour and Fibonacci 38.2% one-month.
Subsequently, recapturing the powerful barrier at $ 1891 is critical for the recovery to gain traction. At the level, the SMA100 one-day, previous day high and pivot point one-day R1 intersect.
The next upside target awaits at $1900, the convergence of SMA200 four-hour and Bollinger Band one-day Middle. Meanwhile, the Fibonacci 61.8% one-month at $1906 is the level to beat for the XAU bulls.
Alternatively, acceptance below the confluence of the Fibonacci 38.2% one-week and one-day at $1880 is needed to unleashing additional downside in the spot.
Sellers will then target $1877 support, where the Fibonacci 23.6% one-month lies. A failure to resist above the last could trigger a fresh drop towards the strong cushion at $1861, the previous week and month low.
Here is how it looks on the tool
About Confluence Detector
The Confluence Detector finds exciting opportunities using Technical Confluences. The TC is a tool to locate and point out those price levels where there is a congestion of indicators, moving averages, Fibonacci levels, Pivot Points, etc. Knowing where these congestion points are located is very useful for the trader, and can be used as a basis for different strategies.
Author

Dhwani Mehta
FXStreet
Residing in Mumbai (India), Dhwani is a Senior Analyst and Manager of the Asian session at FXStreet. She has over 10 years of experience in analyzing and covering the global financial markets, with specialization in Forex and commodities markets.