Gold Price Analysis: Technical setup favors XAU/USD bulls, $1747 remains in sight
- Gold has confirmed a bull pennant breakout on the hourly chart.
- A bull cross is also spotted with RSI in the overbought territory.
- Attention shifts towards the NFP data and next week’s FOMC minutes.

Gold (XAU/USD) staged a solid comeback from multi-month troughs and rallied over 1% on Friday, courtesy of the sell-off in the US dollar across the board.
The greenback tumbled in sync with the Treasury yields amid risk-on market mood. Gold’s fate now hinges on the all-important US NFP report, with the US economy expected to add 647K jobs in March.
Looking at gold’s hourly chart, the odds are in favor of further upside after a bull flag formation got validated into the weekly closing on Thursday.
Adding credence to a potential move higher, the said time frame also displays a bull crossover, with the 21-hourly moving average (HMA) having peeped above the 200-HMA.
Gold Price Chart: One-hour
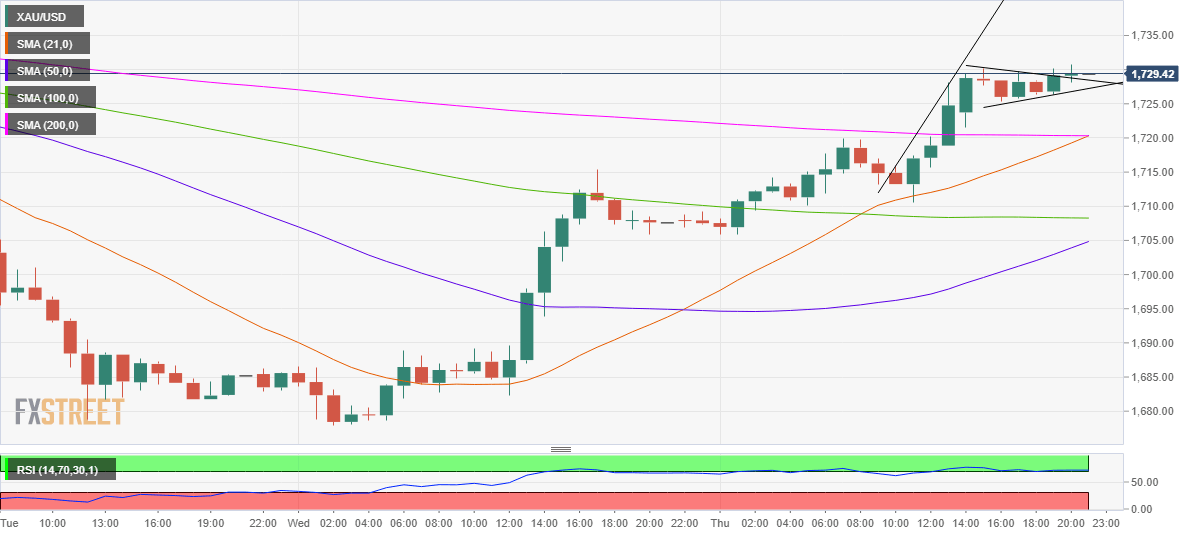
With the bull flag now in play, gold remains poised to test the pattern target at $1747.
The Relative Strength Index (RSI) reflects overbought conditions. Therefore, the buyers could see a temporary pullback in prices before the corrective upside resumes.
To the downside, the confluence of the 21 and 200-HMAs at $1720 could offer immediate comfort to the XAU bulls.
If the bearish pressure intensifies, a test of the 100-HMA at $1708 could be inevitable.
Gold: Additional levels
Author

Dhwani Mehta
FXStreet
Residing in Mumbai (India), Dhwani is a Senior Analyst and Manager of the Asian session at FXStreet. She has over 10 years of experience in analyzing and covering the global financial markets, with specialization in Forex and commodities markets.


