|

Gold Price Analysis: Path of least resistance is up, $1,626 next target – Confluence Detector

Gold prices have surpassed the January high – triggered by the Iranian crisis – and have reached the highest since 2013. The coronavirus scare is among the upside drivers. 

The Technical Confluences Indicator is showing that support lines are stronger than resistance, implying that the rally still has room to run. 

XAU/USD is benefiting from two substantial clusters of support. The first is at $1,613 – above the January low – and it consists of the previous daily high and the Pivot Point one-week Resistance 3. 

The next defensive barrier is at $1,611, which is the convergence of the Simple Moving Average 50-15m, the SMA 10-1h, and the January high. 

Looking up, weak resistance awaits Gold at $1,617, which is the confluence of the Bollinger Band one-hour Upper, the SMA 5-15m, the SMA 10-15m, and the Pivot Point one-day Resistance 1. 

The upside target is $1,626 where XAU/USD faces fiercer resistance – the long-term Pivot Point one-month Resistance 1 awaits it there. 

Overall, the precious metal's price has significant cushions and few junctures of resistance lines, allowing for more rises.

Here is how it looks on the tool:
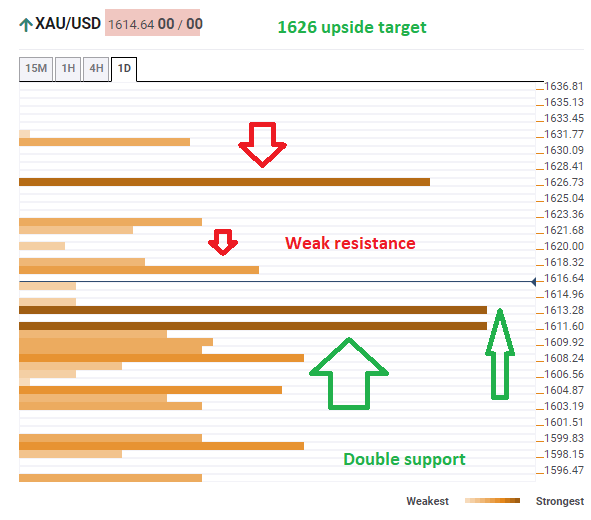
Gold confluence technical February 20 2020

Confluence Detector

The Confluence Detector finds exciting opportunities using Technical Confluences. The TC is a tool to locate and point out those price levels where there is a congestion of indicators, moving averages, Fibonacci levels, Pivot Points, etc. Knowing where these congestion points are located is very useful for the trader, and can be used as a basis for different strategies.

This tool assigns a certain amount of “weight” to each indicator, and this “weight” can influence adjacents price levels. These weightings mean that one price level without any indicator or moving average but under the influence of two “strongly weighted” levels accumulate more resistance than their neighbors. In these cases, the tool signals resistance in apparently empty areas.

Learn more about Technical Confluence

Author

Yohay Elam

Yohay Elam

FXStreet

Yohay is in Forex since 2008 when he founded Forex Crunch, a blog crafted in his free time that turned into a fully-fledged currency website later sold to Finixio.


More from Yohay Elam
Share:

Editor's Picks

GBP/USD off highs, back to 1.3620

GBP/USD remains slightly on the defensive at the end of the week, receding to the low 1.3600s after hitting fresh tops past 1.3670 earlier in the day. Cable’s correction comes after two daily gains in a row and amid a tepid advance in the Greenback, while poor UK data also accompany the downside.

EUR/USD treads water below 1.1700

EUR/USD now trades with modest losses around 1.1670 following another unsuccessful atempt to advance past 1.1700 the figure in a convincing fashion. The pair’s decline follows a maginal rebound in the US Dollar as market participants continue to assess recent US data as well as developments from the US bond market.

Gold gains momentum above $4,600 on US Treasury buyback plans
Gold price (XAU/USD) gains traction to around $4,625 during the early Asian trading hours on Monday. The precious metal climbs to the highest since May 15 as the US Treasury's buyback support plan weighs on the US Dollar (USD).
Week ahead: Fed’s Jackson Hole and Nvidia earnings to dictate markets
The new Fed chair, Kevin Warsh, has made few public appearances since taking the central bank helm in May, yet he’s found it difficult to steer off controversy. Question marks about his relations with the President, Donald Trump, continue to swirl, while markets are still trying to make sense of his approach to monetary policy.
CFTC Report: Oil positioning rebounds; VIX and Yen exposure turn more bearish
The week in one sentence: Speculative positioning turned more constructive in the week to August 18. WTI recorded the largest increase, followed by a sharp narrowing in CAD net shorts. VIX and JPY positioning moved the other way, while Gold remained the clearest crowded long despite a softer spot price.
$20 billion offered, $2 billion taken: Why Treasury doubled its buyback cap

The US Treasury moved off its own calendar on Wednesday, and that is the part worth sitting with. At 12:32 GMT, the department said it would at least double the size of liquidity support buyback operations in the 10-year to 20-year and 20-year to 30-year sectors, lifting the maximum from $2 billion per operation to at least $4 billion, effective September 9 and running to November 4.















