Gold Price Analysis: Below $1,500, inside weekly symmetrical triangle


  • Gold prices fail to hold onto recovery gains, stays inside the weekly triangle.
  • Sellers can aim for November 2019 low during the downside break.
  • 200-bar SMA, an eight-day-old falling trend line offer key resistance.

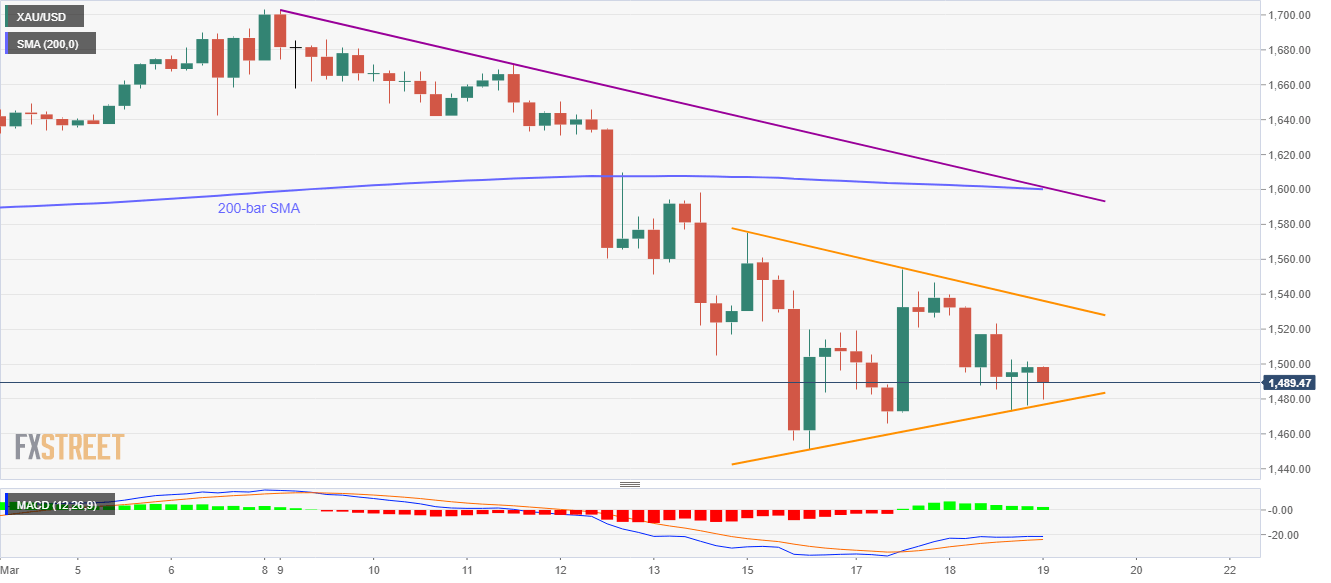
Gold prices remain on the back foot while declining to $1,484 amid Thursday’s Asian session. Even so, the weekly symmetrical triangle restricts the bullion’s moves off-late.

Should the bullish MACD propel the quote to cross $1,477 immediate upside barrier, a confluence of 200-bar SMA and a short-term descending trend line, around $1,600 can question the buyers.

However, the yellow metal’s sustained run-up past-$1,600 enables the buyers to aim for $1,630 and $1,670 numbers to the north.

Alternatively, the sellers’ entry below the triangle’s support near $1,475 can quickly recall the weekly low surrounding $1,451 while November 2019 low close to $1,445 could lure the nears afterward.

Gold four-hour chart

Trend: Sideways

Additional important levels

Overview
Today last price 1491.53
Today Daily Change 5.43
Today Daily Change % 0.37%
Today daily open 1486.1
 
Trends
Daily SMA20 1610.59
Daily SMA50 1585.64
Daily SMA100 1535.85
Daily SMA200 1501.75
 
Levels
Previous Daily High 1546.57
Previous Daily Low 1472.8
Previous Weekly High 1703.4
Previous Weekly Low 1504.72
Previous Monthly High 1689.4
Previous Monthly Low 1547.56
Daily Fibonacci 38.2% 1500.98
Daily Fibonacci 61.8% 1518.39
Daily Pivot Point S1 1457.08
Daily Pivot Point S2 1428.05
Daily Pivot Point S3 1383.31
Daily Pivot Point R1 1530.85
Daily Pivot Point R2 1575.59
Daily Pivot Point R3 1604.62


Share: Feed news

Information on these pages contains forward-looking statements that involve risks and uncertainties. Markets and instruments profiled on this page are for informational purposes only and should not in any way come across as a recommendation to buy or sell in these assets. You should do your own thorough research before making any investment decisions. FXStreet does not in any way guarantee that this information is free from mistakes, errors, or material misstatements. It also does not guarantee that this information is of a timely nature. Investing in Open Markets involves a great deal of risk, including the loss of all or a portion of your investment, as well as emotional distress. All risks, losses and costs associated with investing, including total loss of principal, are your responsibility. The views and opinions expressed in this article are those of the authors and do not necessarily reflect the official policy or position of FXStreet nor its advertisers. The author will not be held responsible for information that is found at the end of links posted on this page.

If not otherwise explicitly mentioned in the body of the article, at the time of writing, the author has no position in any stock mentioned in this article and no business relationship with any company mentioned. The author has not received compensation for writing this article, other than from FXStreet.

FXStreet and the author do not provide personalized recommendations. The author makes no representations as to the accuracy, completeness, or suitability of this information. FXStreet and the author will not be liable for any errors, omissions or any losses, injuries or damages arising from this information and its display or use. Errors and omissions excepted.

The author and FXStreet are not registered investment advisors and nothing in this article is intended to be investment advice.

Recommended content


Recommended content

Editors’ Picks

EUR/USD tests the major level of 1.0650; followed by the nine-day EMA

EUR/USD tests the major level of 1.0650; followed by the nine-day EMA

EUR/USD remains lackluster during the early Tuesday, hovering near 1.0650. From a technical perspective, analysis suggests a bearish sentiment for the pair as it struggles below the pullback resistance at the 1.0695 level. 

EUR/USD News

GBP/USD: Flat lines around mid-1.2300s, bearish potential seems intact

GBP/USD: Flat lines around mid-1.2300s, bearish potential seems intact

GBP/USD holds steady on Tuesday amid subdued USD demand, albeit lacks bullish conviction. The divergent Fed-BoE policy expectations turn out to be a key factor acting as a headwind. The technical setup suggests that the path of least resistance for the pair is to the downside.

GBP/USD News

Gold could see a rebound before resuming the correction

Gold could see a rebound before resuming the correction

Gold price sees a fresh leg down in Asia on Tuesday even as risk flows dissipate. Receding fears over Middle East escalation offset subdued US Dollar and Treasury bond yields. Gold remains heavily oversold on the 4H chart, rebound appears in the offing.  

Gold News

PENDLE price soars 10% after Arthur Hayes’ optimism on Pendle derivative exchange

PENDLE price soars 10% after Arthur Hayes’ optimism on Pendle derivative exchange

Pendle price is among the top performers in the cryptocurrency market today, posting double-digit gains. Its peers in the altcoin space are not as forthcoming even as the market enjoys bullish sentiment inspired by Bitcoin price.

Read more

After Monday's relief rally, attention shifts to earnings and policy fronts

After Monday's relief rally, attention shifts to earnings and policy fronts

With the easing of tensions in the Middle East, safe-haven demand reversed course; global stock markets experienced a modicum of relief. Indeed, in a classic relief rally fashion, Monday saw a rebound in the S&P 500, snapping a six-day losing streak.

Read more

Forex MAJORS

Cryptocurrencies

Signatures