Gold Price Analysis: Bears need break of current support for $1,765 target
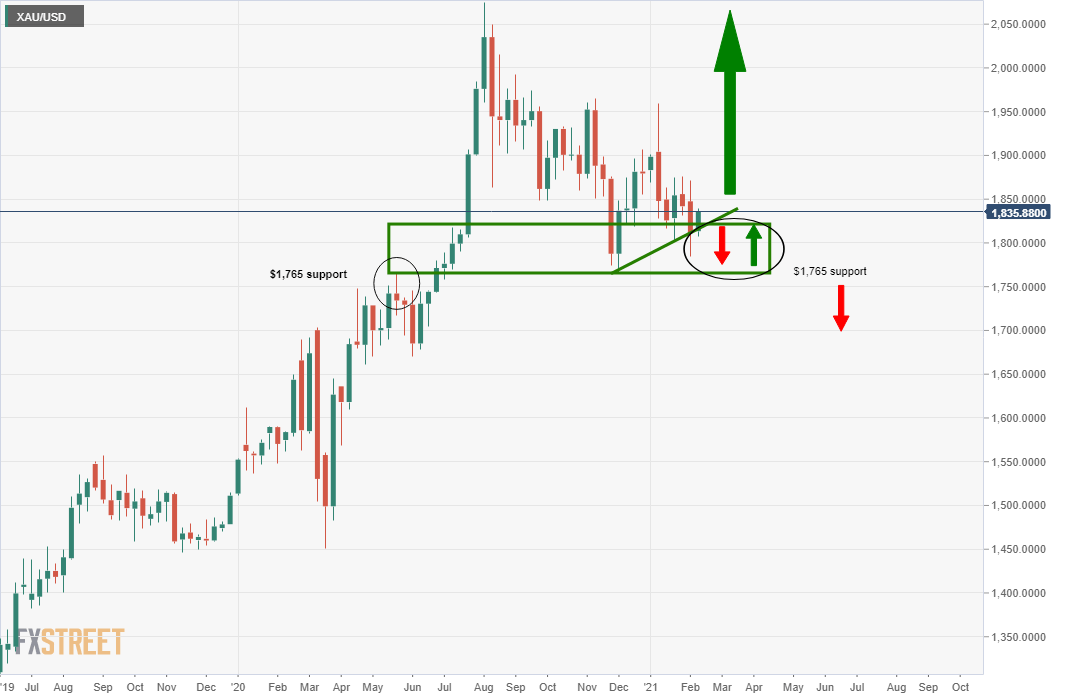
- Gold prices are firmly in the hands of the bears targeting weekly support of $1,765.
- There has been a battle for territory on the hourly charts with a significant rejection at a 61.8% Fibonacci retracement resistance level.

As per the prior analysis, Gold Price Analysis: Bears in control below critical resistance, a significant layer of support was noted, as illustrated on the 4-hour chart below:
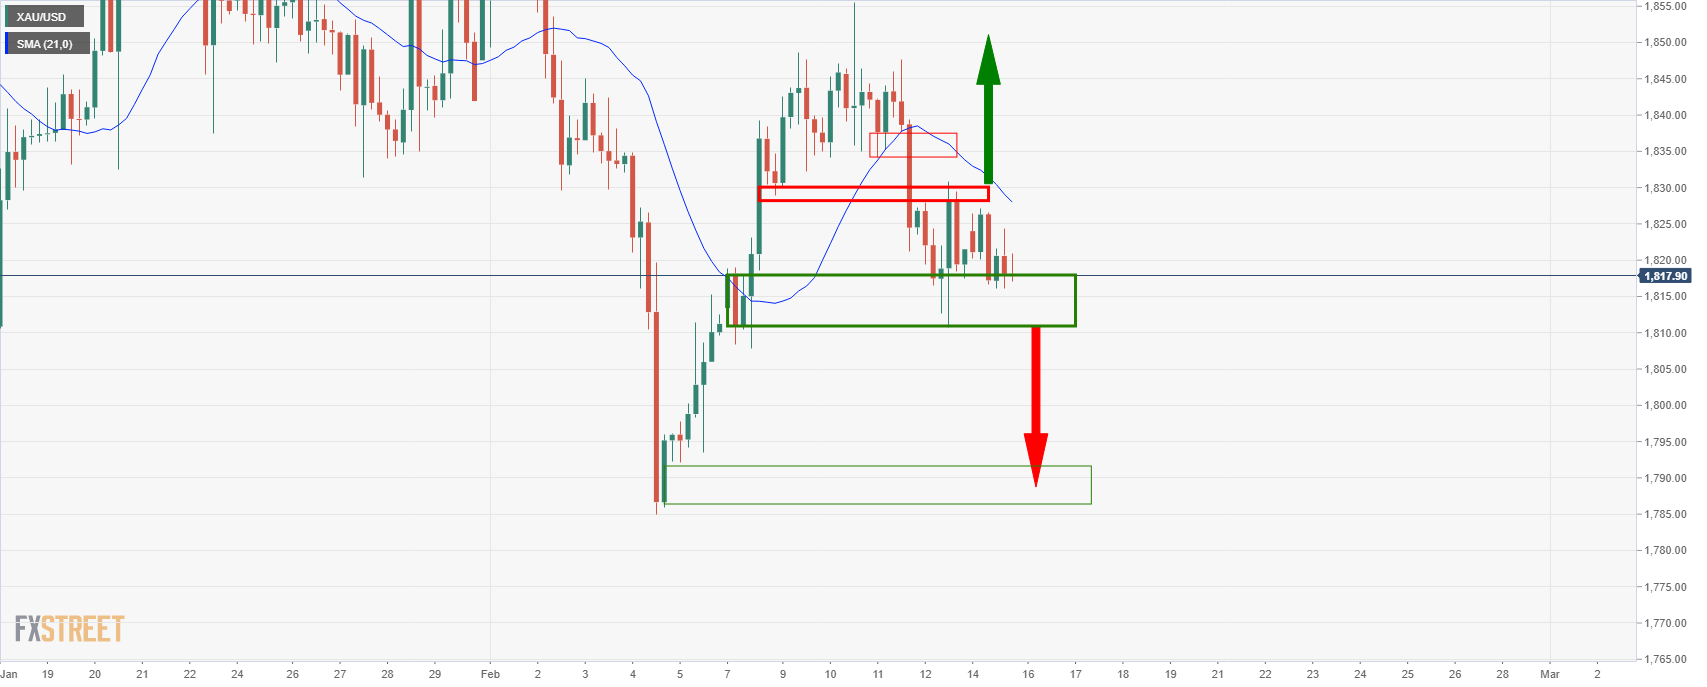
However, it was also explained that while the price was below resistance, then the bias remained to the downside.
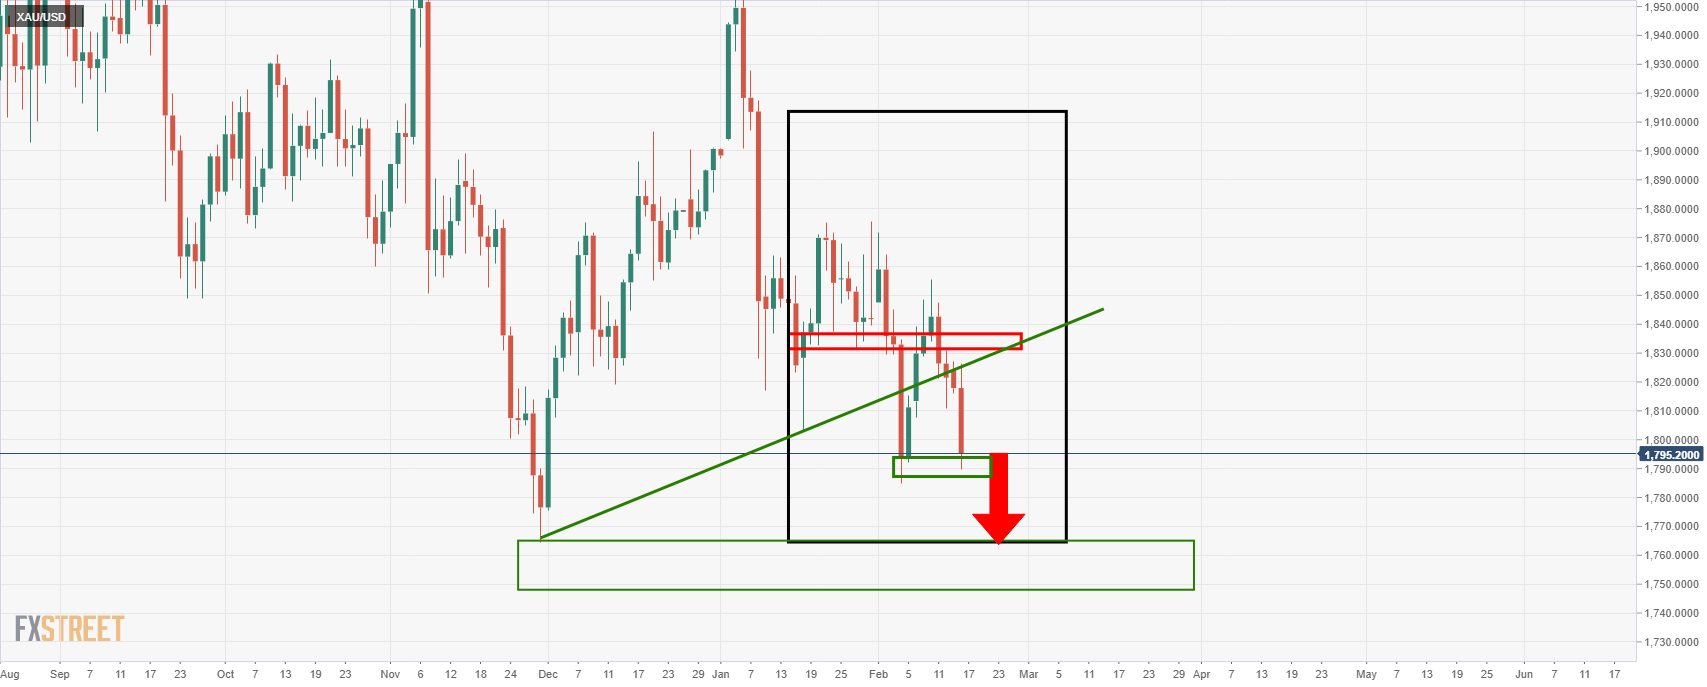
The resistance had been identified last week on the daily chart as follows:
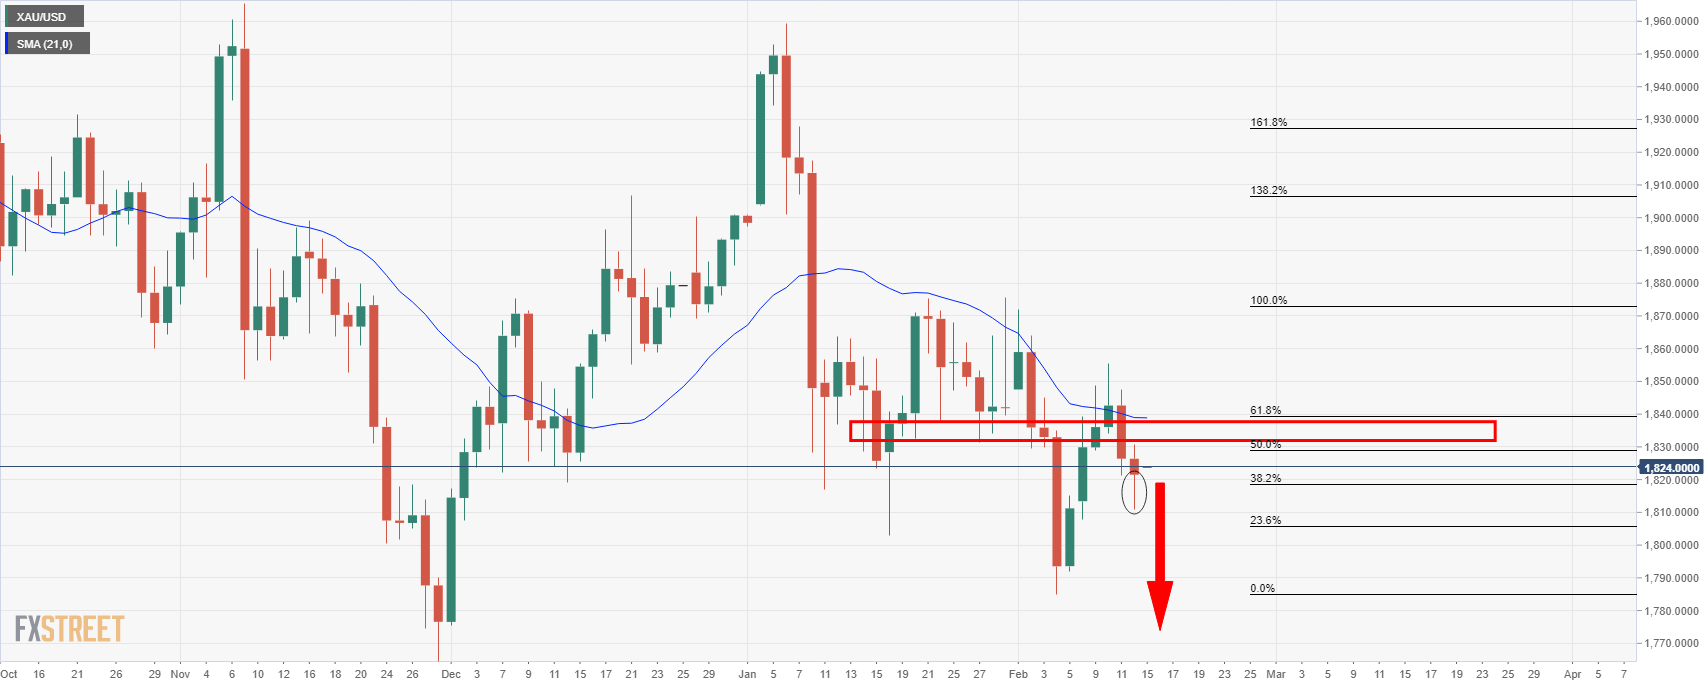
The wick was expected to be filled in.
Subsequently, the price action has played out into the hands of the bears:
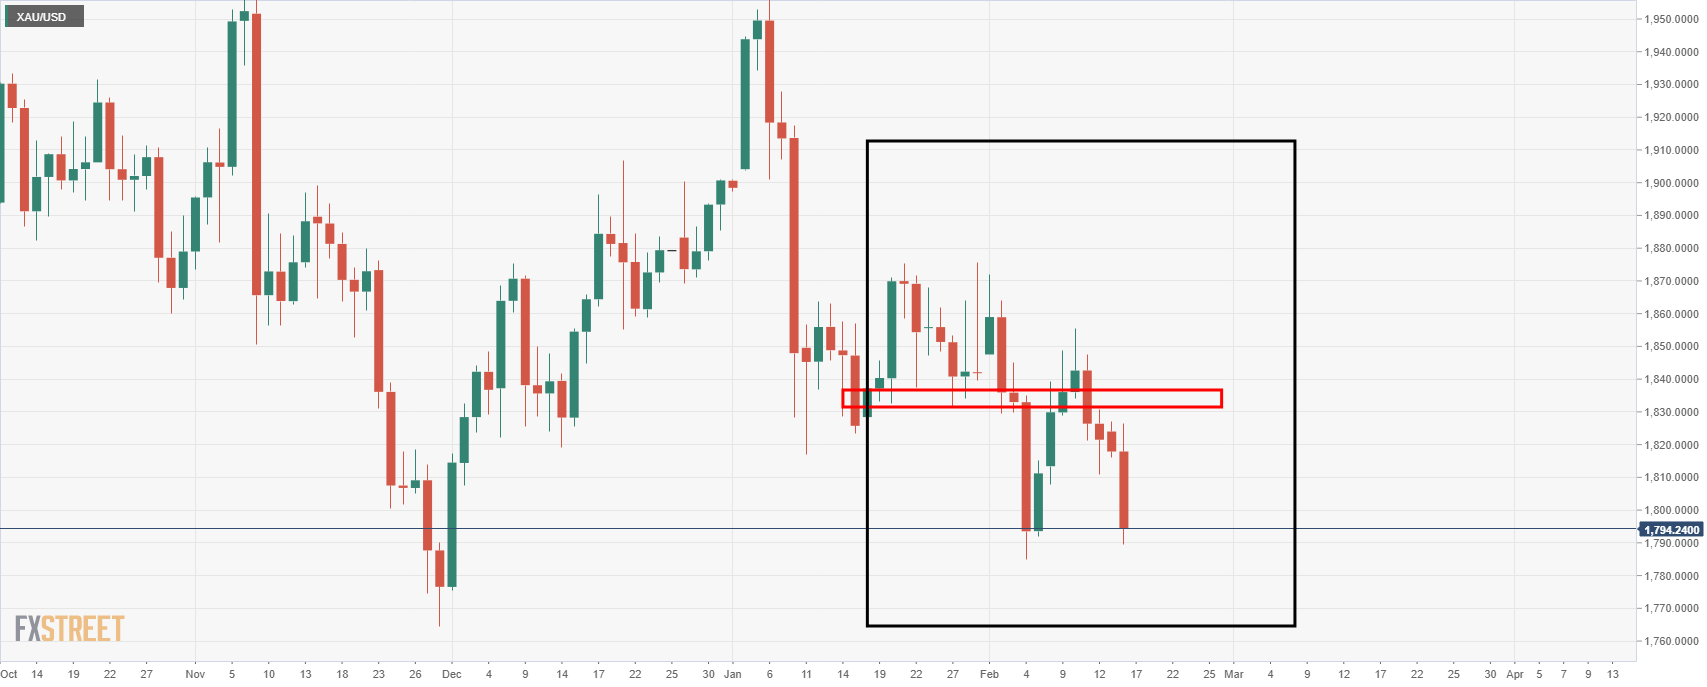
Where now?
Going back a little further to the original analysis, Gold Price Analysis: Bears to target a run to weekly support at $1,765, a weekly demand area had been identified as the target as follows:
In subsequent analysis, Gold Price Analysis: Bulls slammed at critical resistance, focus is on weekly target again, it was illustrated from a daily perspective, that this may play out as follows:
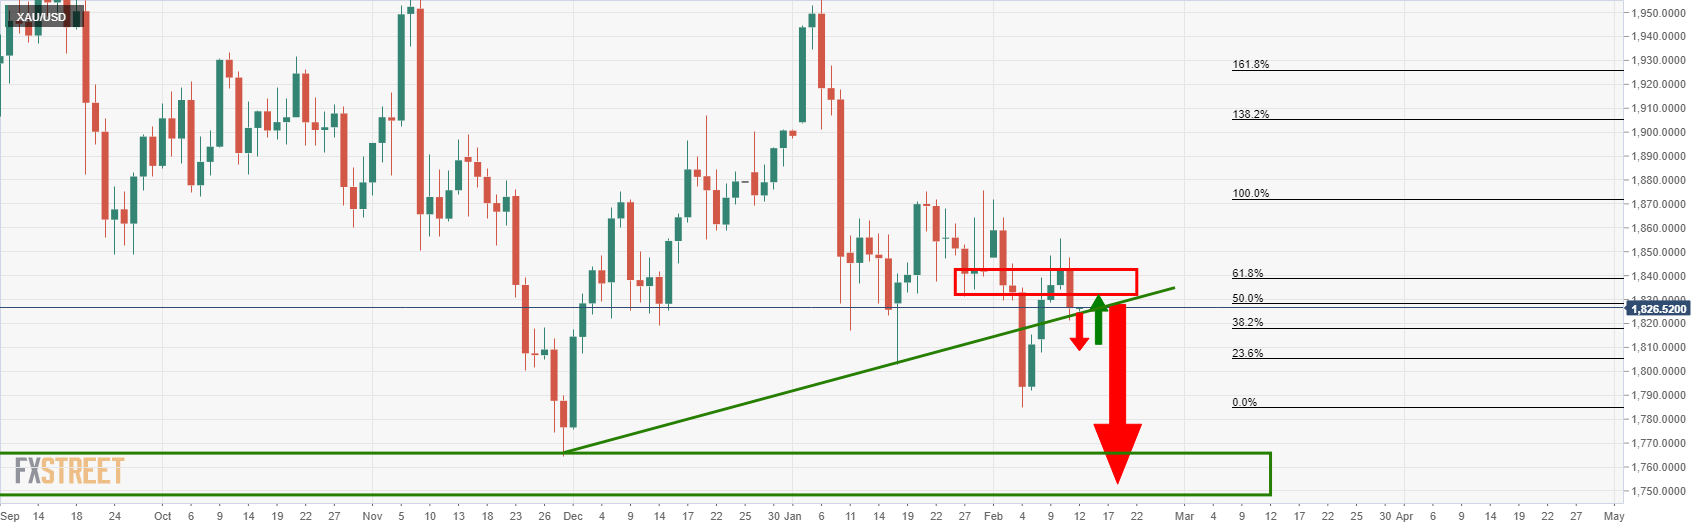
Live market, daily chart
So far so good, however, the price has typically been rejected on the first test of the prior lows.
With that said, the weekly target remains in play.
Of note, $1,765 is also a -272% Fibonacci retracement of the recent daily bullish correction's range and would be expected to be reached.
Live market, 4-hour chart
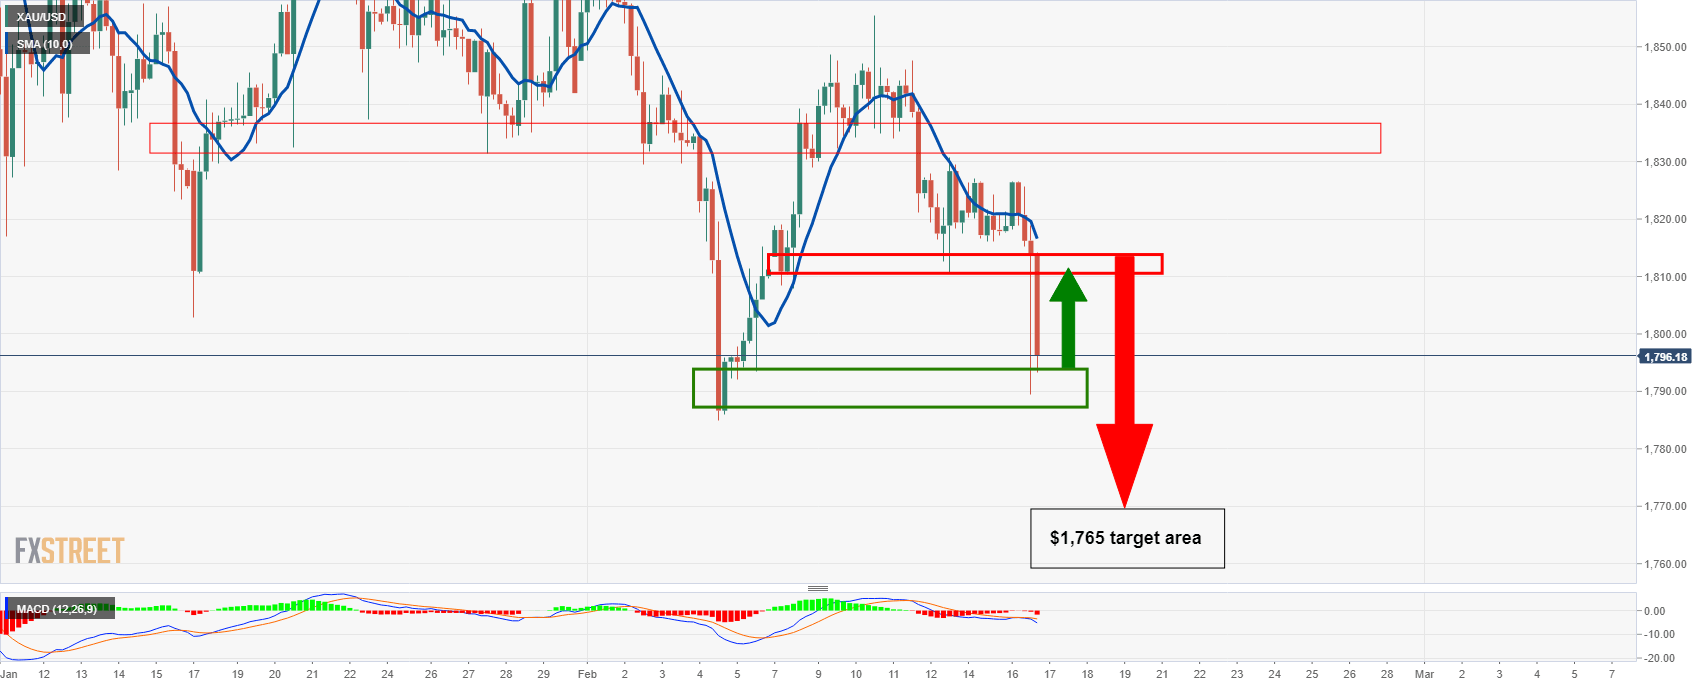
The 4-hour chart's technical conditions are also bearish.
In recent trade, we have already seen a strong rejection of the bull's attempts to take the price back to resistance.
This can be seen more easily on the hourly time frame as follows:
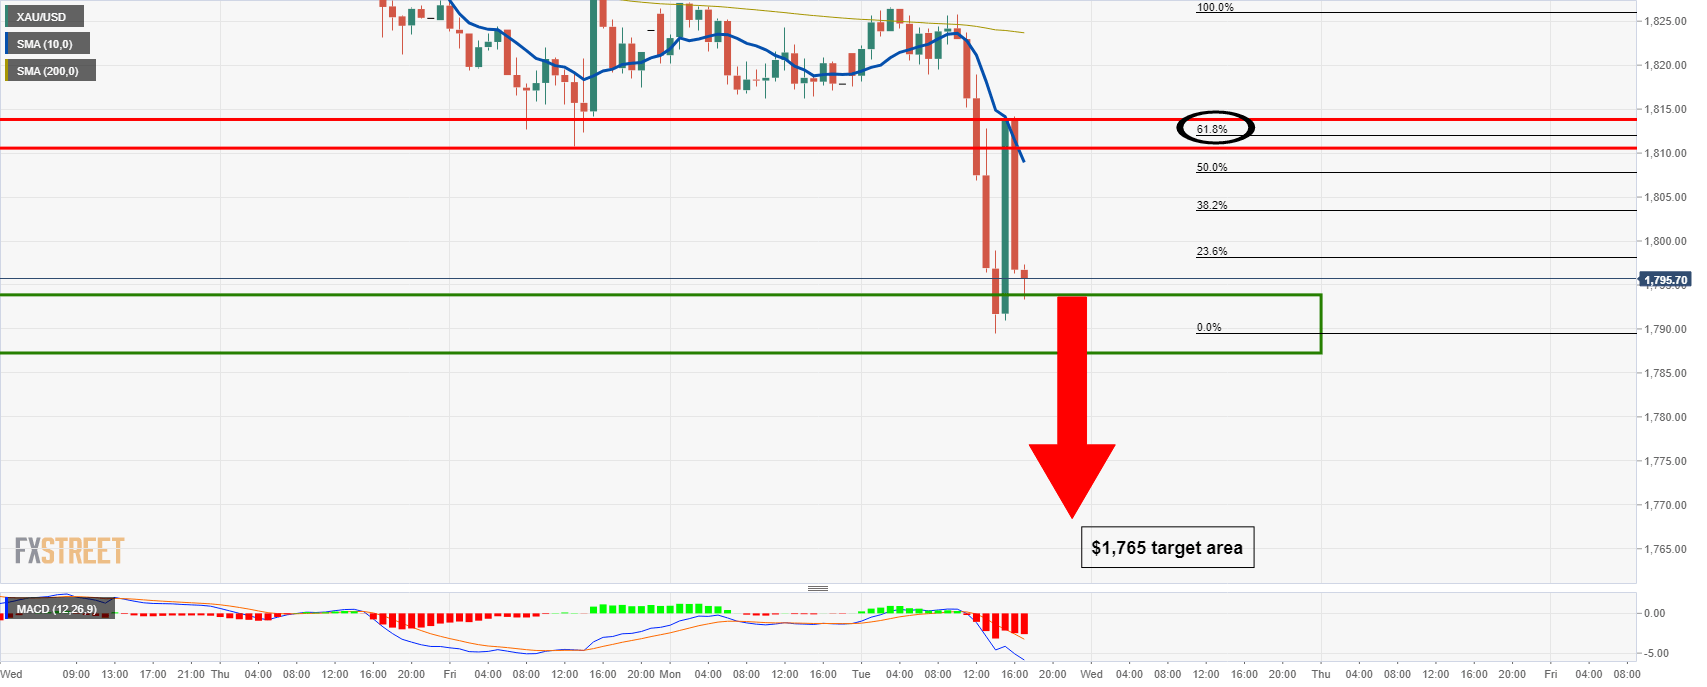
Bulls may well have dried up at this juncture having been rejected at a 61.8% Fibonacci retracement of the prior bearish impulse on the hourly chart.
Weak hands would be expected to now give way to a downside extension over the coming sessions. However, first of all, some consolidation within the recent ranges would not be out of the question as volatility settles down.
Author

Ross J Burland
FXStreet
Ross J Burland, born in England, UK, is a sportsman at heart. He played Rugby and Judo for his county, Kent and the South East of England Rugby team.


