Gold Price Analysis: 50-HMA, immediate rising wedge probe XAU/USD bounce off $1,764


  • Gold prices battle key resistance confluence around $1,785/86.
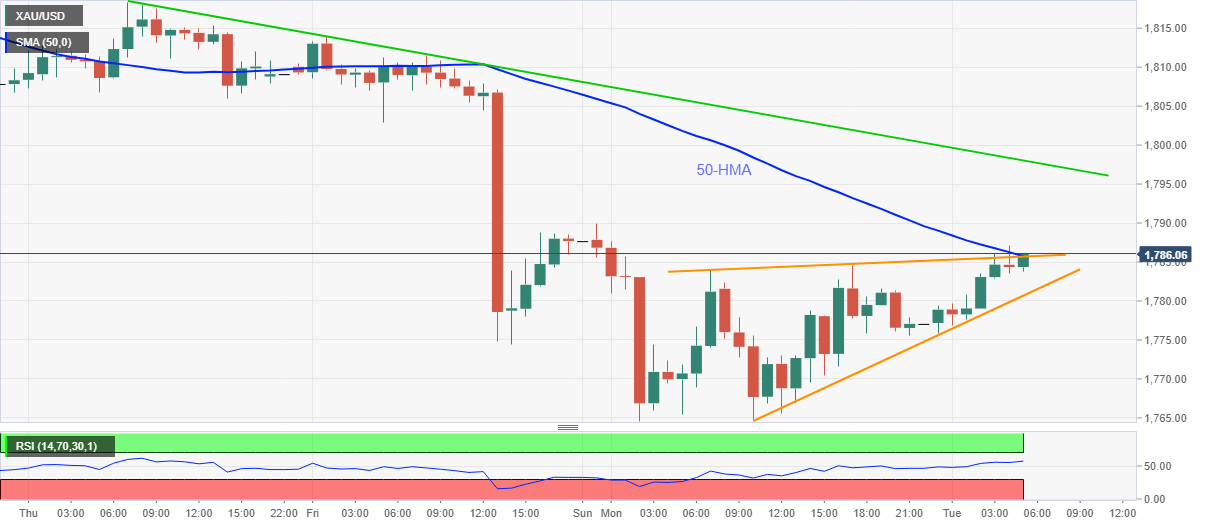
  • Three-day-old falling trendline adds to the upside filters.
  • Fresh selling will wait for a confirmation of the bearish chart pattern.

Gold picks up the bids near $1,785, up 0.50% intraday, while heading into Tuesday’s European session. The yellow metal dropped to the five-month low the previous day, before bouncing off $1,764.60.

While oversold RSI conditions favored the bullion buyers to portray gradual recovery moves, the underlying bearish pattern, rising wedge, keeps sellers hopeful. Additionally, failures to cross 50-HMA and short-term resistance line are some extra points favoring the gold bears.

However, the south-run needs confirmation from the downside break of rising wedge’s support, at $1,780.70 now, before eyeing the latest multi-month low near $1,764. It should also be noted that May 2018 peak surrounding $1,765 adds strength to the support ahead of highlighting the April 218 high of $1,747.82.

Meanwhile, an upside clearance of $1,786 resistance confluence needs to cross a falling trend line from November 26, currently near $1,798 before confirming the further recoveries.

During the quote’s sustained run-up past-$1,798, the $1,800 round-figure holds the key to further north-run towards September’s low around $1,849.

Gold hourly chart

Trend: Pullback expected

Additional important levels

Overview
Today last price 1785.56
Today Daily Change 8.99
Today Daily Change % 0.51%
Today daily open 1776.57
 
Trends
Daily SMA20 1864.09
Daily SMA50 1882.81
Daily SMA100 1910.03
Daily SMA200 1799.86
 
Levels
Previous Daily High 1790
Previous Daily Low 1764.6
Previous Weekly High 1876.14
Previous Weekly Low 1774.4
Previous Monthly High 1965.58
Previous Monthly Low 1764.6
Daily Fibonacci 38.2% 1774.3
Daily Fibonacci 61.8% 1780.3
Daily Pivot Point S1 1764.11
Daily Pivot Point S2 1751.66
Daily Pivot Point S3 1738.71
Daily Pivot Point R1 1789.51
Daily Pivot Point R2 1802.46
Daily Pivot Point R3 1814.91


Share: Feed news

Information on these pages contains forward-looking statements that involve risks and uncertainties. Markets and instruments profiled on this page are for informational purposes only and should not in any way come across as a recommendation to buy or sell in these assets. You should do your own thorough research before making any investment decisions. FXStreet does not in any way guarantee that this information is free from mistakes, errors, or material misstatements. It also does not guarantee that this information is of a timely nature. Investing in Open Markets involves a great deal of risk, including the loss of all or a portion of your investment, as well as emotional distress. All risks, losses and costs associated with investing, including total loss of principal, are your responsibility. The views and opinions expressed in this article are those of the authors and do not necessarily reflect the official policy or position of FXStreet nor its advertisers. The author will not be held responsible for information that is found at the end of links posted on this page.

If not otherwise explicitly mentioned in the body of the article, at the time of writing, the author has no position in any stock mentioned in this article and no business relationship with any company mentioned. The author has not received compensation for writing this article, other than from FXStreet.

FXStreet and the author do not provide personalized recommendations. The author makes no representations as to the accuracy, completeness, or suitability of this information. FXStreet and the author will not be liable for any errors, omissions or any losses, injuries or damages arising from this information and its display or use. Errors and omissions excepted.

The author and FXStreet are not registered investment advisors and nothing in this article is intended to be investment advice.

Recommended content


Recommended content

Editors’ Picks

EUR/USD clings to daily gains above 1.0650

EUR/USD clings to daily gains above 1.0650

EUR/USD gained traction and turned positive on the day above 1.0650. The improvement seen in risk mood following the earlier flight to safety weighs on the US Dollar ahead of the weekend and helps the pair push higher.

EUR/USD News

GBP/USD recovers toward 1.2450 after UK Retail Sales data

GBP/USD recovers toward 1.2450 after UK Retail Sales data

GBP/USD reversed its direction and advanced to the 1.2450 area after touching a fresh multi-month low below 1.2400 in the Asian session. The positive shift seen in risk mood on easing fears over a deepening Iran-Israel conflict supports the pair.

GBP/USD News

Gold holds steady at around $2,380 following earlier spike

Gold holds steady at around $2,380 following earlier spike

Gold stabilized near $2,380 after spiking above $2,400 with the immediate reaction to reports of Israel striking Iran. Meanwhile, the pullback seen in the US Treasury bond yields helps XAU/USD hold its ground.

Gold News

Bitcoin Weekly Forecast: BTC post-halving rally could be partially priced in Premium

Bitcoin Weekly Forecast: BTC post-halving rally could be partially priced in

Bitcoin price shows no signs of directional bias while it holds above  $60,000. The fourth BTC halving is partially priced in, according to Deutsche Bank’s research. 

Read more

Geopolitics once again take centre stage, as UK Retail Sales wither

Geopolitics once again take centre stage, as UK Retail Sales wither

Nearly a week to the day when Iran sent drones and missiles into Israel, Israel has retaliated and sent a missile into Iran. The initial reports caused a large uptick in the oil price.

Read more

Forex MAJORS

Cryptocurrencies

Signatures