Gold rebounds after soft US inflation data bolsters Fed rate cut bets
- Gold rebounds as soft US inflation data boosts demand for the precious metal amid rising interest rate cut expectations.
- Headline CPI rose 0.3% MoM, below the 0.4% forecast, while core inflation eased to 3.0% YoY.
- Markets price in nearly 99% odds of another Fed rate cut at the October 29-30 meeting, with further easing expected in December.

Gold (XAU/USD) stages a rebound on Friday, trimming intraday losses after softer-than-expected US Consumer Price Index (CPI) data. At the time of writing, XAU/USD is trading around $4,130, recovering from session lows near $4,044, though the metal remains on track to snap its nine-week winning streak.
The weaker inflation data reinforced expectations of a 25-basis-point (bps) rate cut at the Federal Reserve’s (Fed) October 29-30 monetary policy meeting. Lower borrowing costs typically enhance the appeal of non-yielding assets like Gold, as they reduce the opportunity cost of holding the metal.
Market sentiment somewhat improved amid hopes of a de-escalation in the renewed US-China trade standoff. The White House confirmed on Thursday that US President Donald Trump will meet his Chinese counterpart Xi Jinping on October 30 on the sidelines of the APEC Summit in South Korea, a development that helped ease recent trade tensions.
Despite the recent volatility, the fundamental backdrop for Gold remains supportive. The prolonged United States (US) government shutdown and persistent geopolitical and economic uncertainties continue to drive safe-haven demand for the yellow metal.
Market movers: US CPI takes center stage ahead of high-level trade talks
- The latest data from the US Bureau of Labor Statistics (BLS) showed that the Consumer Price Index (CPI) rose 0.3% MoM in September, missing the 0.4% forecast and down from August’s 0.4%. On an annual basis, headline inflation rose 3.0%, coming in below expectations of 3.1% and slightly above the 2.9% pace recorded in August.
- The Core CPI, which excludes food and energy components, also rose 0.2% MoM, below the 0.3% forecast and matching the 0.3% gain recorded in August. On a yearly basis, core inflation rose 3.0%, below the 3.1% forecast and the 3.1% reading seen in the previous month.
- The S&P Global Flash Composite Purchasing Managers Index (PMI) for October rose to 54.8, up from 53.9 in September, marking the strongest pace of private-sector expansion in three months. The Services PMI surged to 55.2 from 54.2, while the Manufacturing PMI edged higher to 52.2 from 52.
- The University of Michigan (UoM) survey showed that consumer sentiment weakened in October, with the headline index falling to 53.6 from 55.1 in September and the Consumer Expectations Index slipping to 50.3 from 51.7. Meanwhile, inflation expectations were mixed, with the 1-year outlook holding steady at 4.6%, while the 5-year measure edged up to 3.9% from 3.7%.
- US-China trade headlines dominate markets after flaring up earlier this month following China’s decision to expand export restrictions on rare earth materials. In response, President Donald Trump threatened to impose 100% tariffs on Chinese imports starting November 1, prompting tit-for-tat measures, including shipping and port fees on both sides.
- US Treasury Secretary Scott Bessent and US Trade Representative Jamieson Greer will meet with Chinese Vice Premier He Lifeng in Malaysia on Friday for high-level economic and trade discussions aimed at easing recent tensions.
- US-Canada trade tensions escalate. President Donald Trump announced on Thursday that the US is terminating all trade negotiations with Canada, citing a controversial ad aired by Ontario’s provincial government.
Technical analysis: XAU/USD weakens as sellers defend $4,150 resistance zone
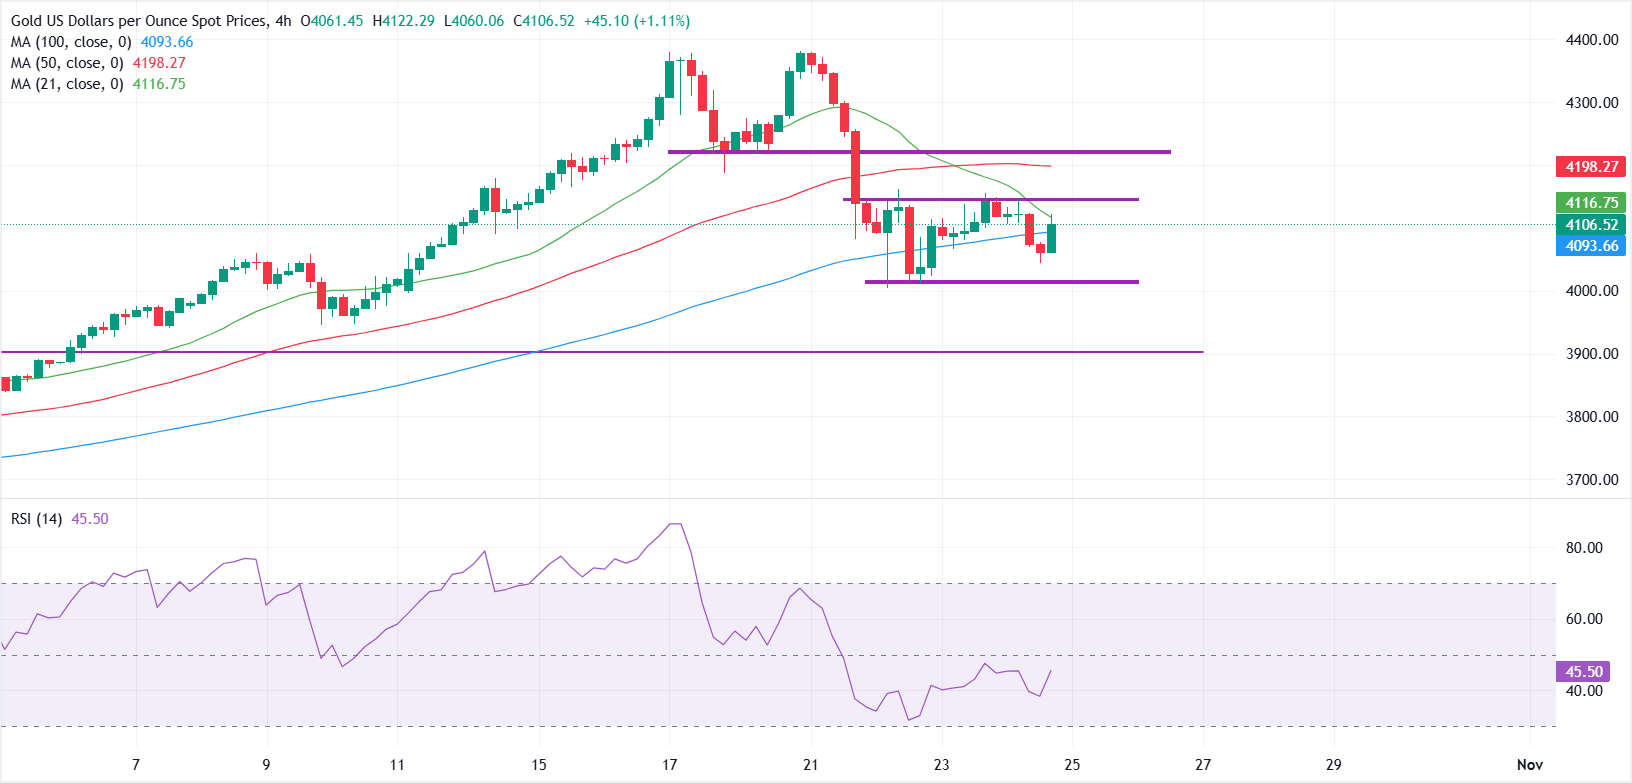
XAU/USD is showing early signs of consolidation after a strong rally. The short-term outlook has turned bearish as the metal now trades below the 21, 50, and 100-period Simple Moving Averages (SMAs) on the 4-hour chart, signaling weakening bullish momentum.
On the downside, the $4,000 psychological mark remains a key support zone where dip buyers have been active in recent sessions. A decisive break below this area could trigger a deeper pullback toward the $3,900 region.
On the upside, the 100-SMA near $4,090 acts as immediate resistance, followed by $4,150. A sustained move above this zone would open the path toward the $4,200 level, where stronger selling pressure is likely to emerge unless bulls manage a clean breakout.
US Dollar Price Today
The table below shows the percentage change of US Dollar (USD) against listed major currencies today. US Dollar was the strongest against the Canadian Dollar.
| USD | EUR | GBP | JPY | CAD | AUD | NZD | CHF | |
|---|---|---|---|---|---|---|---|---|
| USD | -0.05% | -0.08% | 0.21% | 0.23% | 0.03% | 0.00% | 0.02% | |
| EUR | 0.05% | -0.03% | 0.27% | 0.30% | 0.09% | 0.06% | 0.07% | |
| GBP | 0.08% | 0.03% | 0.27% | 0.32% | 0.12% | 0.08% | 0.10% | |
| JPY | -0.21% | -0.27% | -0.27% | 0.04% | -0.17% | -0.20% | -0.18% | |
| CAD | -0.23% | -0.30% | -0.32% | -0.04% | -0.22% | -0.24% | -0.23% | |
| AUD | -0.03% | -0.09% | -0.12% | 0.17% | 0.22% | -0.03% | -0.02% | |
| NZD | -0.01% | -0.06% | -0.08% | 0.20% | 0.24% | 0.03% | 0.01% | |
| CHF | -0.02% | -0.07% | -0.10% | 0.18% | 0.23% | 0.02% | -0.01% |
The heat map shows percentage changes of major currencies against each other. The base currency is picked from the left column, while the quote currency is picked from the top row. For example, if you pick the US Dollar from the left column and move along the horizontal line to the Japanese Yen, the percentage change displayed in the box will represent USD (base)/JPY (quote).
Author

Vishal Chaturvedi
FXStreet
I am a macro-focused research analyst with over four years of experience covering forex and commodities market. I enjoy breaking down complex economic trends and turning them into clear, actionable insights that help traders stay ahead of the curve.


