Gold futures hits record high around $3,530 after Trump’s tariffs on gold bars
- Gold price futures rally to near $3,534 as the US imposes tariffs on all imports of one-kg Gold bar.
- Fed officials warn of growing labor market risks.
- The Fed is almost certain to cut interest rates in the September policy meeting.

Gold price futures post a fresh all-time high around $3,534.00 on Friday. The precious metal strengthens, following the announcement of tariffs on imports of one-Kilogram (KG) gold bar by United States (US) President Donald Trump, a move that prompted supply concerns.
The Financial Times (FT) reported that a letter from Customs and Border Protection (CBP) stated that one-kg and 100-ounce gold bars should be classified under a customs code subject to higher tariffs. The major victim of tariffs on imports of gold bars will be Switzerland, which is the world’s largest gold refining hub.
Additionally, firm market expectations that the Federal Reserve (Fed) will cut interest rates in the September policy meeting have also strengthened the Gold price. Lower borrowing rates by the Fed improve demand for non-yielding assets, such as Gold.
A slew of Fed officials has stated cooling labor market conditions is paving the way for monetary policy easing. On Wednesday, comments from Minneapolis Fed President Neel Kashkari, and San Francisco Fed President Mary Daly siganled that monetary policy adjustments are needed amid growing economic and labor market concerns.
On Thursday, Atlanta Fed President Raphael Bostic has also warned of slowing job creation, but refrained from committing to resumption of the monetary expansion cycle, citing that price pressures are expected to accelerate in coming months.
Meanwhile, arguments in favor of reducing interest rates by the Fed would get further appreciated with the nomination of Council of Economic Advisers Chairman Stephen Miran by US President Donald Trump as a replacement to Fed Governor Adriana Kugler.
Gold technical analysis
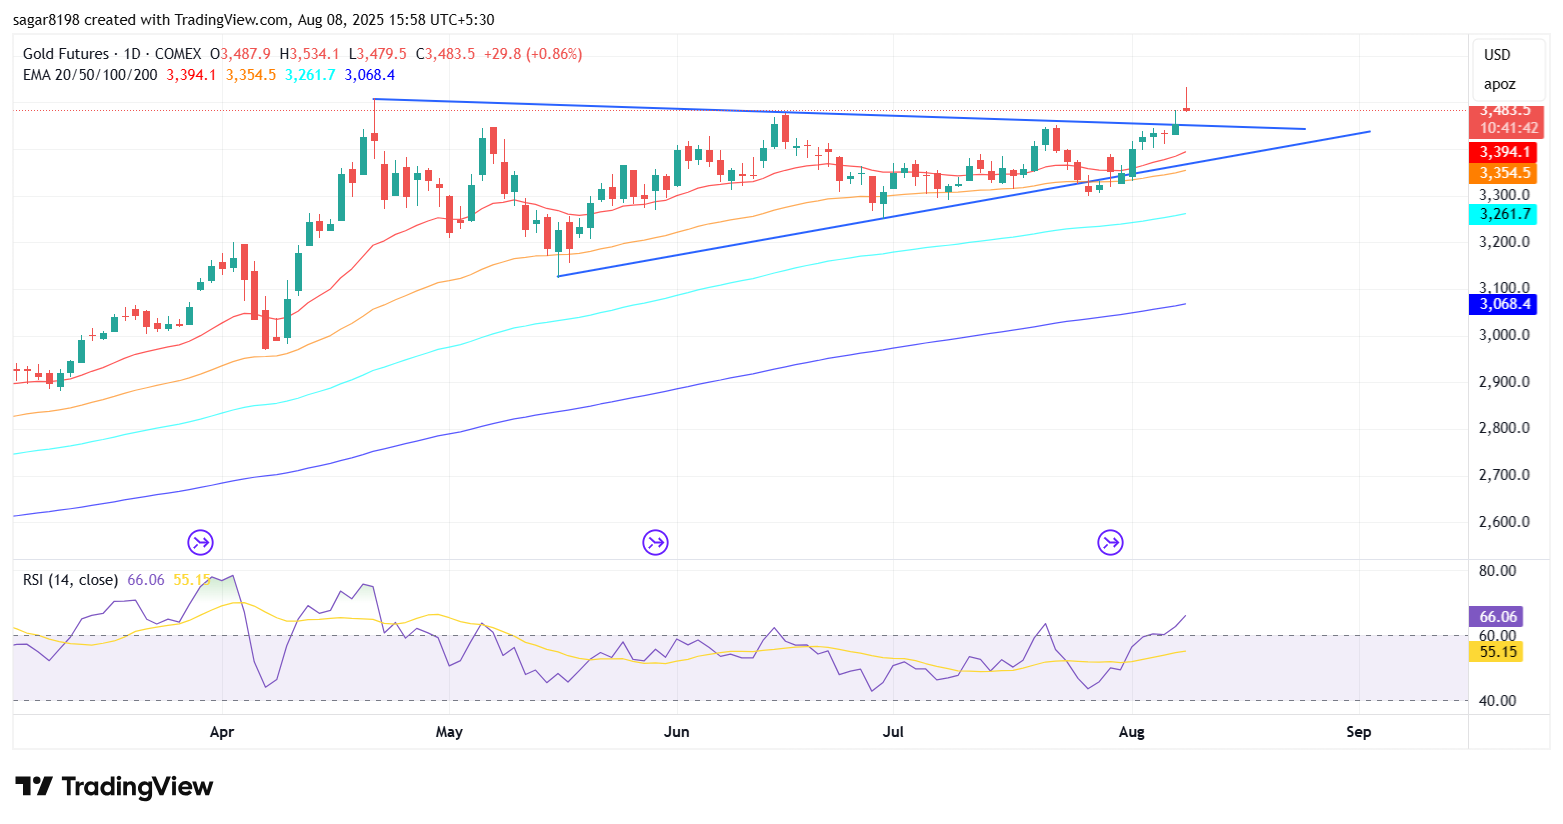
Gold futures deliver a breakout of the Symmetrical Triangle formation on the upside – a move that often leads to volatility expansion. The downside border of the above-mentioned chart pattern is placed from the May 15 low of $3,123.30, while its upside border is plotted from the April 22 high around $3,509.90.
Upward-sloping 20-day Exponential Moving Average (EMA) around $3,397.4 suggests that the near-term trend of the Gold price futures is bullish.
The 14-day Relative Strength Index (RSI) rises above 60.00. A fresh bullish momentum would emerge if the RSI holds above that level.
Looking up, the Gold price had entered an uncharted territory. Potential resistances would be $3,550 and $3,600.
Alternatively, the Gold price would fall towards the round-level support of $3,200 and the May 15 low at $3,123.30, if it breaks below the May 29 low of $3,269.10.
Gold daily chart
(Source: https://www.tradingview.com/chart/LWQ4s95s/?symbol=FX_IDC%3AUSDINR)
Gold FAQs
Gold has played a key role in human’s history as it has been widely used as a store of value and medium of exchange. Currently, apart from its shine and usage for jewelry, the precious metal is widely seen as a safe-haven asset, meaning that it is considered a good investment during turbulent times. Gold is also widely seen as a hedge against inflation and against depreciating currencies as it doesn’t rely on any specific issuer or government.
Central banks are the biggest Gold holders. In their aim to support their currencies in turbulent times, central banks tend to diversify their reserves and buy Gold to improve the perceived strength of the economy and the currency. High Gold reserves can be a source of trust for a country’s solvency. Central banks added 1,136 tonnes of Gold worth around $70 billion to their reserves in 2022, according to data from the World Gold Council. This is the highest yearly purchase since records began. Central banks from emerging economies such as China, India and Turkey are quickly increasing their Gold reserves.
Gold has an inverse correlation with the US Dollar and US Treasuries, which are both major reserve and safe-haven assets. When the Dollar depreciates, Gold tends to rise, enabling investors and central banks to diversify their assets in turbulent times. Gold is also inversely correlated with risk assets. A rally in the stock market tends to weaken Gold price, while sell-offs in riskier markets tend to favor the precious metal.
The price can move due to a wide range of factors. Geopolitical instability or fears of a deep recession can quickly make Gold price escalate due to its safe-haven status. As a yield-less asset, Gold tends to rise with lower interest rates, while higher cost of money usually weighs down on the yellow metal. Still, most moves depend on how the US Dollar (USD) behaves as the asset is priced in dollars (XAU/USD). A strong Dollar tends to keep the price of Gold controlled, whereas a weaker Dollar is likely to push Gold prices up.
Author

Sagar Dua
FXStreet
Sagar Dua is associated with the financial markets from his college days. Along with pursuing post-graduation in Commerce in 2014, he started his markets training with chart analysis.