GME Stock News: GameStop Corp suffers modest fall as broad market dumps
- GameStop shares fall on Wednesday but still not as bad as broad market.
- GME shares broke support on Monday and remain in a downtrend.
- Stock suffers as retail volume slows.

Update May 13: GME shares fell on Wednesday, but it was a modest fall when compared to some of the collapses in other stocks and in the broader market. GME closed down 1.45% on Wednesday, while the Nasdaq fell nearly 3%. GME remains in a bearish formation having broken triangle support.
Update May 11: GameStop shares are struggling for momentum on Tuesday, trading just in the red as other meme stocks post strong gains. AMC is up 3%, while PLTR is up 6%. GameStop broke the triangle support on Monday in a technically bearish move.
Update May 10: Gamestop (GME) shares decided to sit this one out on Friday as the shares barely moved. While everything else caught a bid GME barely moved, closing unchanged. Retail stocks have been sliding as retail moves back outdoors. GME is still holding triangle support but needs to break the 9-day moving average at $163.63 to turn bullish in the short term.
Update April 29: GameStop Corp.(NYSE: GME) shares slide slightly on Thursday, down 2% at $175.35 at the time of writing. no suprise given the strong gains seen on Monday as the stock broke out. GME remains bullish technically as long as it remains above moving average support at $167.92. $218.93 is the next resistance.
Stay up to speed with hot stocks' news!
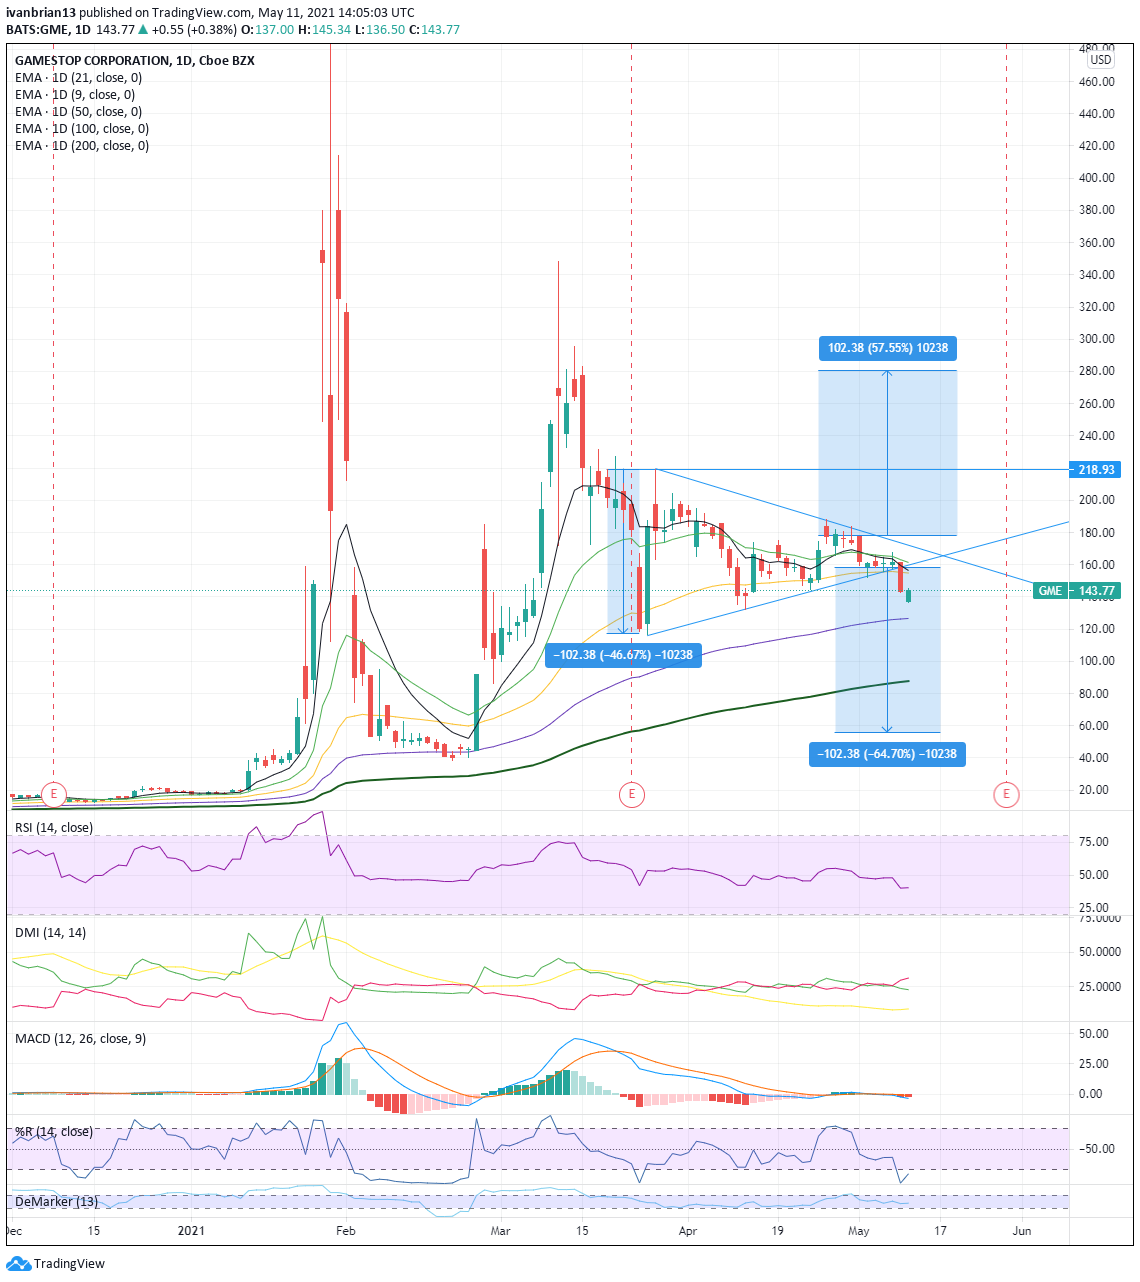
GME stock chart
Fundamentally, GME is way overvalued. Many high growth stocks bring high valuations such as Netflix, as investors bet that earnings will grow into the valuation. This strong growth allows earnings multiples to soften, and eventually a successful company does not look so overvalued on a fundamental basis. Again, the ones such as Netflix, that is.
But GameStop is at a much earlier stage. It does not yet have a proven model and instead is aiming to replicate other online retail strategies. The difference is GameStop has formidable competitors in online game sales from vested interests such as Sony (owner of Playstation) and Microsoft (owner of XBox).
Technically, the picture is still bearish. Each spike high fails lower than the previous one, as evidenced by the downtrend line from the January 28 high.
The MACD crossed over in mid-March giving a sell signal and it remains in a bearish crossover. The Directional Movement Index (DMI) has also crossed over, giving a sell signal. However, this is not a strong signal as the ADX line is below 25, indicating a weak trend and a weak signal.
Apart from the indicators, the chart is also painting a bearish picture. Declining volumes and a triangle formation ultimately will lead to a breakout. Usually, breakouts are sharp and triangle breakouts notably so. GME is below the 9 and 21-day moving averages, which are themselves pointing lower. All bearish signs.
Going short this one can lead to all sorts of troubles as has been well documented. Instead, a bearish position might be best served by purchasing the $140 puts expiring May 7 at a cost of $8.38, thereby limiting your loss in the event of another squeeze. If you take the triangle breakout theory to the letter, then the breakout is the size of the entry, in this case $102. That would give GME a target of $40 on a breakout. So playing more out of the money options of a longer duration might work. The June 18 $70 puts are trading at $2.86.
On the other hand, if GME breaks out of the triangle to the upside, the target would be $264. At present GME is more bearish, but if it breaks the 9 and 21-day moving averages and breaks out of the triangle to the upside, then the picture has changed. Look for confirmation from a MACD crossover and or a DMI crossover.
Previous updates
Update April 29: GameStop Corp (NYSE: GME) shares extended their retreat from two-week highs of $187.99 reached on Tuesday, although closed Wednesday modestly higher at $178.58. The latest leg down was mainly driven by profit-taking after the upsurge. The dovish FOMC decision induced overall lift in US stocks, helping to cushion the downside in the meme stock. The recent run-up in the stock could be attributed to the expectations of some radical changes that the video-gaming company is seeking to make to its business model. Technically, the price is forming higher highs on the daily sticks, backing the bullish scenario.
Update April 28: GameStop Corp (NYSE: GME) shares are seeing some profit-taking after the strong run so far this week. That is despite the company raising $551 million, usually a bearish sign. But enthusiasm among investors remains undimmed and the meme king lives again. GME has retraced toward the 9 and 21 day moving average supports at $165.31 and $164.16 respectively.
GameStop (GME) is still struggling for momentum as retail volume exits the markets for the real world. Volume across all meme favourites – GME, AMC, PLTR, KOSS and others – has dropped. Volatility is also down sharply in these names, though it could not have gotten much higher.
GME shares have been fighting back in an otherwise downtrend and technically still look bearish. The last few sessions have seen price rises run into resistance from the 9 and 21-day moving averages. The Moving Average Convergence Divergence (MACD) indicator also is in a crossover sell signal formation from mid-March.
Update April 27: After rising as much as 11% in premarket trading, GameStop Corp Inc (NYSE: GME) started the second day of the week sharply higher and touched its strongest level since April 6 at $188. Although GME retreated modestly in the last hours, it's still up 7% on the day, trading around $180. In the near term, the technical outlook seems to have turned bullish with the price breaking out of the triangle that formed on the daily chart. In the meantime, the S&P 500 Index trades flat on the day near 4,190 as investors stay on the sidelines ahead of the FOMC's policy meeting.
Update April 27: GameStop Corp Inc (NYSE: GME) has kicked off Tuesday's trading session with a significant increase of over 6.54% to nearly $180. This is the third consecutive day of increases for the video-gaming company that has attracted retail traders. As described below, technicals favor bulls, with a clear objective in sight. The next moves of Ryan Cohen are closely watched by those interested in fundamentals.
Update: GME shares roared higher on Monday, breaking out of their triangle formation and closing near the intraday – a bullish sign. GME signed for a near 12% gain to close at $168.93. It was very much risk-on across the meme stock space as all stocks rallied sharply. GME now remains bullish with support at $163.79 and $159.61, the key to the short-term trend. The first target is the high from March 26 of $218.93.
At the time of writing, the author has no position in any stock mentioned in this article and no business relationship with any company mentioned. The author has not received compensation for writing this article, other than from FXStreet.
This article is for information purposes only. The author and FXStreet are not registered investment advisors and nothing in this article is intended to be investment advice. It is important to perform your own research before making any investment and take independent advice from a registered investment advisor.
FXStreet and the author do not provide personalized recommendations. The author makes no representations as to accuracy, completeness, or the suitability of this information. FXStreet and the author will not be liable for any errors, omissions or any losses, injuries or damages arising from this information and its display or use. The author will not be held responsible for information that is found at the end of links posted on this page.
Errors and omissions excepted.
Premium
You have reached your limit of 3 free articles for this month.
Start your subscription and get access to all our original articles.
Author

Ivan Brian
FXStreet
Ivan Brian started his career with AIB Bank in corporate finance and then worked for seven years at Baxter. He started as a macro analyst before becoming Head of Research and then CFO.


