GCC (Wisdomtree commodity strategy fund) calling for higher commodities

GCC (Wisdom Tree Commodity Strategy Fund) is a great indicator for commodities direction. This Fund is positively correlated with Oil. Previously, we have mentioned the idea that the Fund reached the blue box area back in 03.2020. Since then, it has started a rally which looks like a nest. A nest is a series of 1-2. Most of the time a nest happens before a huge move takes place. The following chart shows what a nest looks like:
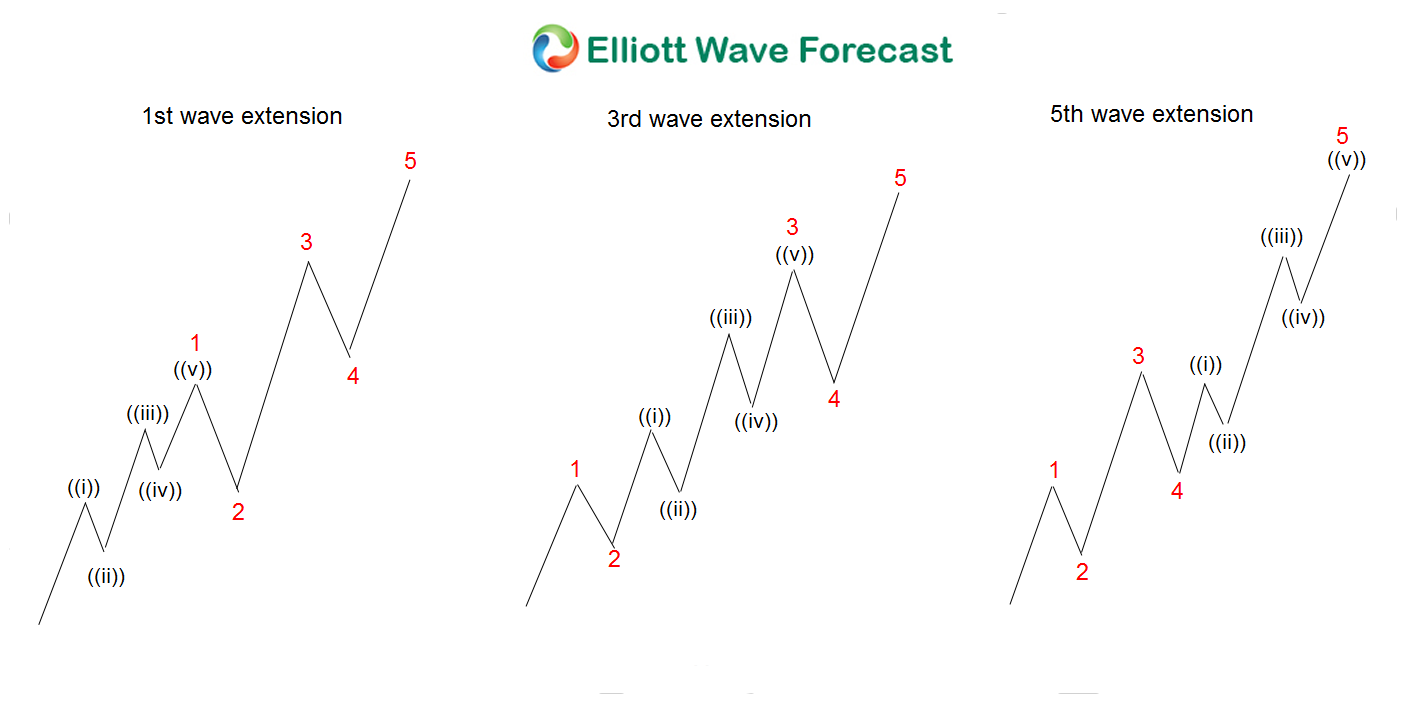
As we can see in the graph above, a nest is a series of 1-2 coming off from the lows. A nest happens within one of the three main impulses. It either happens within waves 1, 3, or 5. Most of the time it happens within wave 3 like the second graph above shows. This often confuses traders because they see a three wave rally from the low. Due to the 3 waves rally, traders mistakenly believe the previous bearish cycle trend remains in place. But of course that turns out not to be the case when a nest takes place.
GCC monthly Elliott Wave chart
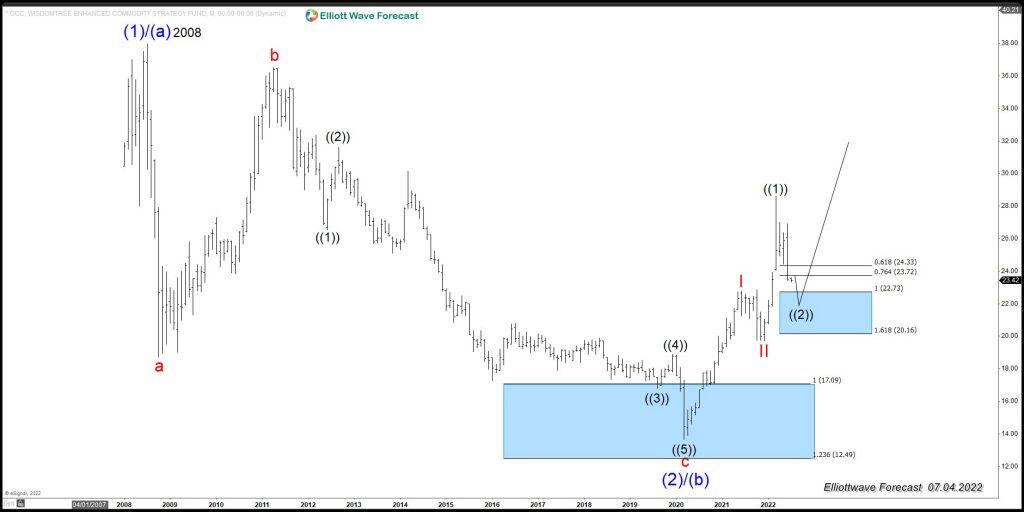
The monthly chart of GCC above shows a three waves pullback since the peak in 2008 into the blue box buying area. Based on the Elliott Wave Theory and common sense, it’s hard to see the Fund breaks below $13.59 again. Thus we believe the nest is the right count of the rally from wave (2) low. As we mentioned previously, the Fund has a strong relationship with Oil, as shown in the following chart:
Correlation chart of GCC and oil
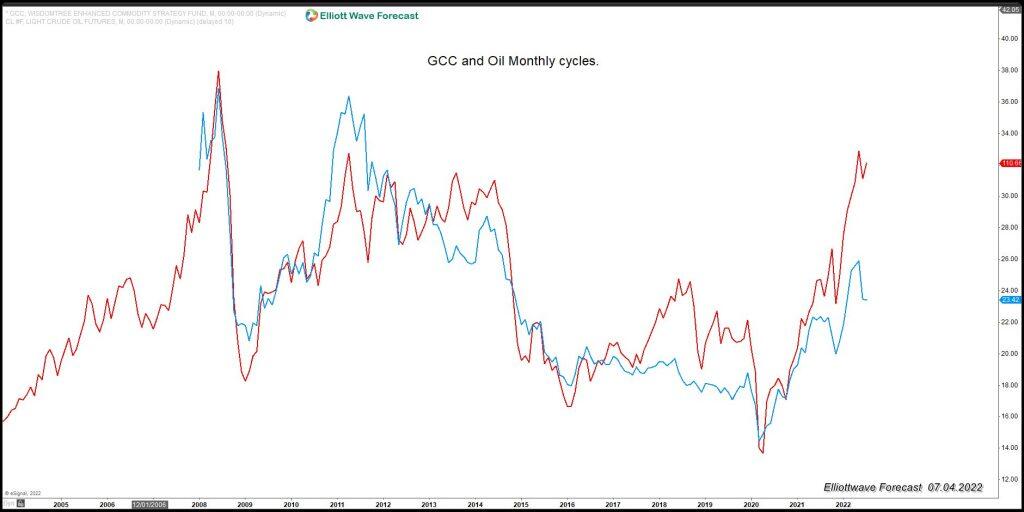
As we can see from the chart above, they trade on the same side, and share almost identical highs/lows. This makes us believe that Oil is also nesting, and higher prices will come in the coming years. GCC as a commodity fund also relates to Gold and Silver, as we show in the following chart:
Correlation chart of GCC and gold
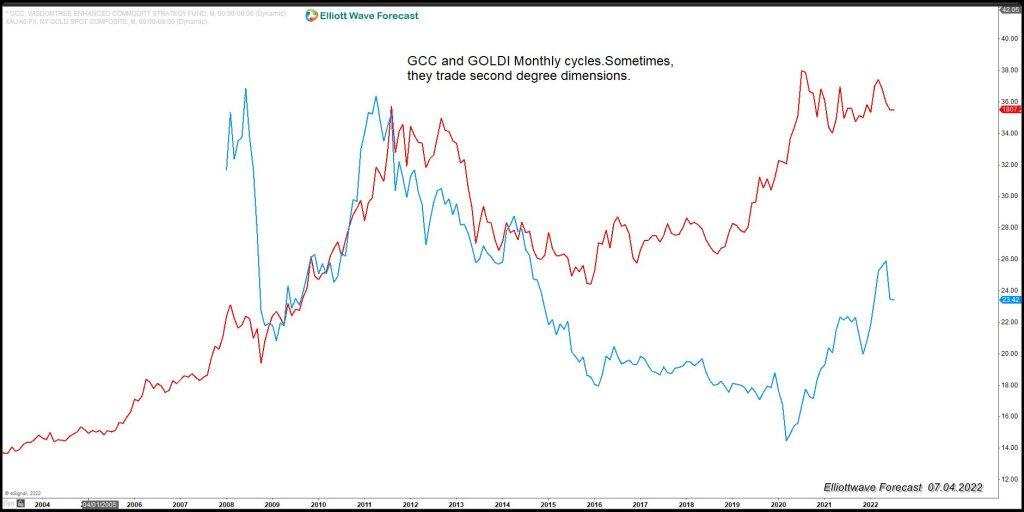
The correlation between the Fund and Gold is not as direct and straightforward unlike with Oil. But there is no question that higher GCC means higher Gold and Silver. The Fund is a base and different commodity has a different weight in the fund. Oil has a bigger weight than Gold and Silver in the fund, hence the higher correlation between the Fund and Oil.
GCC weekly Elliott Wave chart
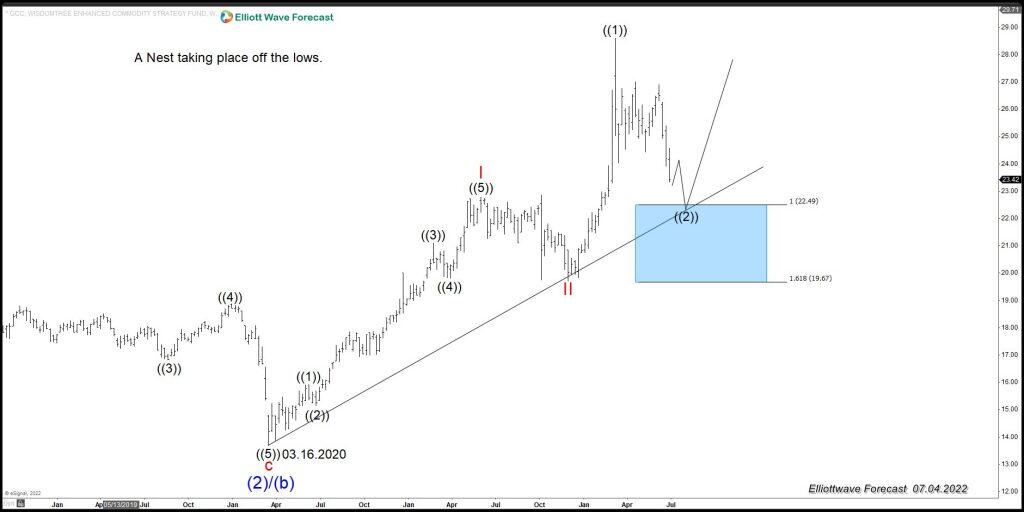
GCC sees two cycles of five waves since the lows at 03.01.2020. We think the Fund is forming a nest, and soon we might see a break higher into new all-time highs. This might take Oil into the $170.00-$200.00 area, something which might be scary for many. To us, this is something which is very realistic looking at the charts and price action. GCC should see buyers between $22.73-$20.16 area. The area should agree with Oil trading between $86.29-$63.25. This area can be the beginning of wave ((3)) higher in Oil. Many people have been calling Indices to crash, but tend to forget that GCC and Oil relate to World Indices as the following chart shows:
Correlation chart of GCC and SPX
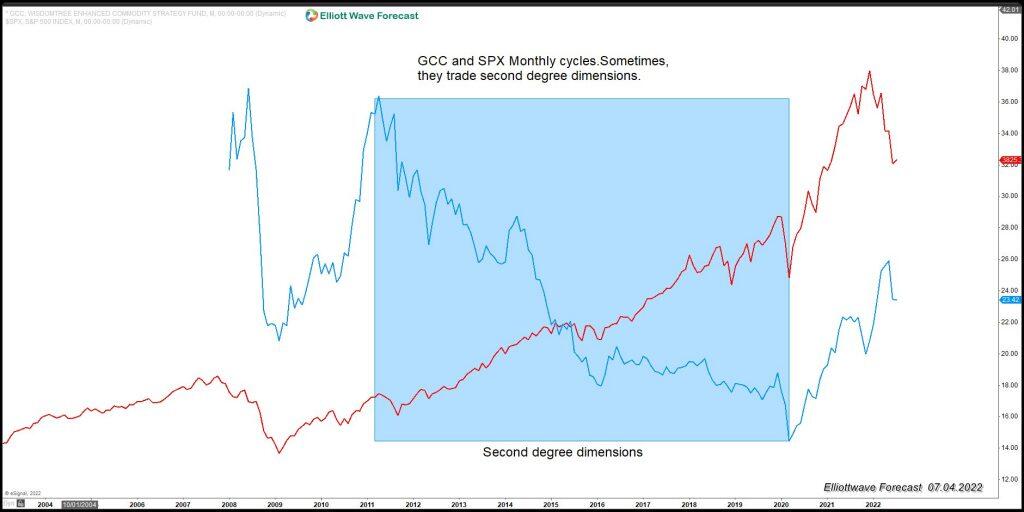
The chart above shows the correlation between GCC and $SPX. As we can see, they correlate in each swing higher/lower. Sometimes they have direct correlation and sometimes in second-degree correlation. The first degree correlation is when they trade in the same direction both in swing as well as overall direction. The second degree correlation is when they agree on the swing direction, but not in the overall direction. In the end, GCC is reacting off the blue box. GCC doing a nest might be a warning for soon-to-happen higher Indices, Commodities, and something in which traders asking for a market crash might not be getting the wish.
Author

Elliott Wave Forecast Team
ElliottWave-Forecast.com


