GBP/USD wavers amid US CPI data; traders focus on UK’s GDP
- GBP/USD touched a weekly high of 1.2818 but paired those gains, plunging afterward below 1.2700.
- US CPI stood above 3%, while Core CPI remains sticky at around the highs 4%.
- Market participants’ attention shifts towards the release of UK GDP figures for Q2.

With the release of US inflation data in the United States (US), exceeding the prior’s month reading but below estimations, the GBP/USD reacted upwards, reaching a fresh week high of 1.2818. Nevertheless, as US Treasury bond yields soared, the US Dollar (USD) is staging a comeback, as the GBP/USD exchanges hands at 1.2687, down 0.24%.
The pair reaches a week’s high but trims gains as market waits for key data release from the UK
The US Bureau of Labor Statistics (BLS) revealed that prices during July in the US rose above the previous month’s 3% YoY but less than estimates of 3.3%, seen as a sign that prices are cooling down. The Consumer Price Index (CPI) rose by 3.2%. The same report showed that core CPI dipped to 4.7% YoY, below June’s and estimates of 4.8%, portraying the stickiness of the report.
Although the data is encouraging, the Federal Reserve (Fed) would remain data dependent, as the San Francisco Fed President Mary Daly commented that it’s too early to declare victory, stressing she remains data dependent, and backed July’s 25 bps rate hike. When asked about easing monetary conditions, she added it’s a “long way from a conversation about rate cuts.”
Further data revealed that the labor market gave another sign of easing, though it should be viewed cautiously, as the latest figures have not been consistent. Initial Jobless Claims for the week ending July 29 exceeded forecasts of 230K, advanced 248K.
After the data, traders slashed bets the Fed would raise rates again, as shown by money market futures. The CME FedWatch Tools portrays the chances for a rate hike in September below 10%, while for the November meeting, it dropped to 23.6% from 33.8% a month ago.
Given the backdrop, the GBP/USD rallied sharply. Still, market participants faded the move, as data from the United Kingdom is expected to show the country’s exit from the recessionary territory, as the Gross Domestic Product (GDP) for the last Quarter would be released. If the UK posts solid numbers, the GBP/USD might gain traction and retest the 1.2800 mark. Otherwise, the GBP/USD would resume its downtrend and extend its losses past the 100-day EMA, with traders eyeing the 200-day EMA.
GBP/USD Price Analysis: Technical outlook
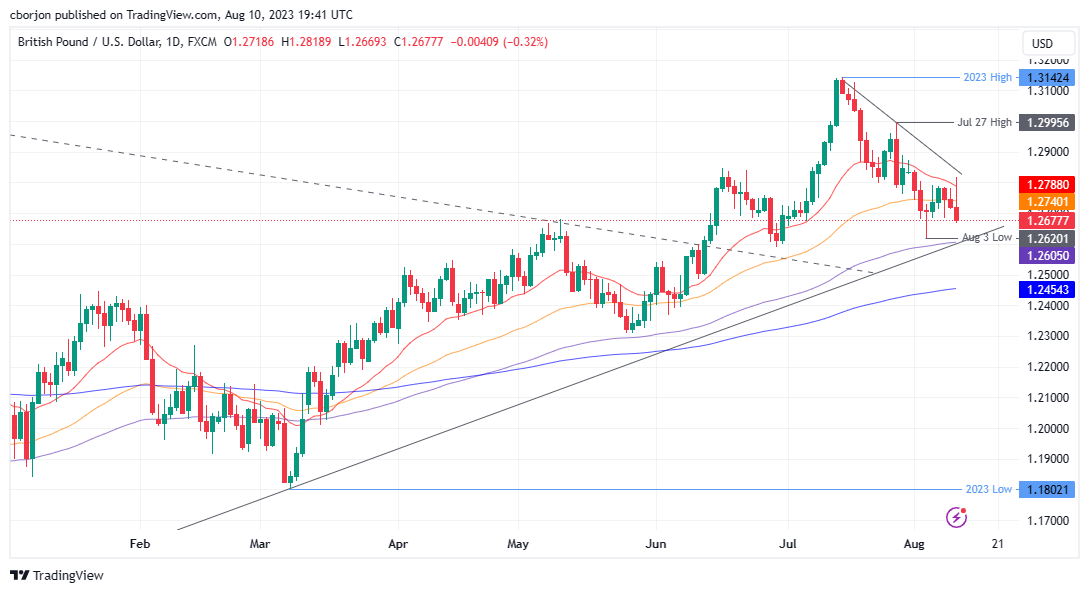
GBP/USD’s failure to hold to its gains above 1.2800 offered sellers a better entry price as traders faded the uptick, exerting downward pressure on the pair. In addition, the GBP/USD printed a new weekly low, opening the door for a test of the August 3 daily low of 1.2620. A breach of the latter will expose the 100-day Exponential Moving Average (EMA) at 1.2605, followed by the 1.2600 psychological figure. On the other hand, the GBP/USD could retest 1.2800 if the buyers reclaim 1.2700.
Author

Christian Borjon Valencia
FXStreet
Markets analyst, news editor, and trading instructor with over 14 years of experience across FX, commodities, US equity indices, and global macro markets.


