GBP/USD tumbles from 20-week high as markets reverse flows back into the US Dollar, aimed for 1.2700
- GBP/USD spread in both directions on Thursday, climbing to a multi-month high before pulling back.
- US Dollar flows are dominating the FX market to wrap up 2023.
- US data misses initially sparked a risk rally, but rising Treasury yields ended it just as quickly.

The GBP/USD rose in early Thursday’s trading window, climbing to a 20-week high before slumping back and seeing a downside extension sparked by an unexpected climb in US Treasury yields during a 7-year T-note auction.
The US Dollar (USD) is now flat on the week against the Pound Sterling (GBP), declining nearly 0.9% from Thursday’s high as the GBP/USD heads back towards the 1.2700 handle.
Treasury yields cut risk rally short
The last trading week of 2023 has been largely marked by a long-winded risk rally that has seen the US Dollar decline across the board as money markets tilt fully into risk-on territory as investors lean into bets of an accelerated pace of rate cuts from the Federal Reserve (Fed) in 2024, but a policy pivot from the US central bank is still well off into the future, and risk bids were caught by surprise by an unexpected uptick in US Treasury yields during a 7-year note auction.
US 7-year Treasury yields rose from 3.837% to 3.859% on Thursday in a $40 billion bond auction, sparking a reversal of the week’s risk appetite flows. Risk bids were extended by misses in US economic data early Thursday, with US Initial Jobless Claims and Pending Home Sales both missing the mark.
US weekly Initial Jobless Claims rise to 218K vs. 210K expected
Deflating US economic indicators helped to step up market expectations of Fed rate cuts coming sooner rather than later, but jitters in bond yields quickly ended the late week’s “bad news is good news” narrative as investors retreated into the safe haven US Dollar in the second-last trading day of the year.
US Pending Home Sales unchanged in November
The last trading week of 2023 will wrap up on Friday with low-impact UK Nationwide Housing Prices, to be followed by the US Chicago Purchasing Managers’ Index (PMI). UK Housing Prices are expected to hold flat at 0.0% in December compared to November’s 0.2% increase, while the Chicago PMI is forecast to slip from November’s 55.8 to 51.0 in December.
GBP/USD Technical Outlook
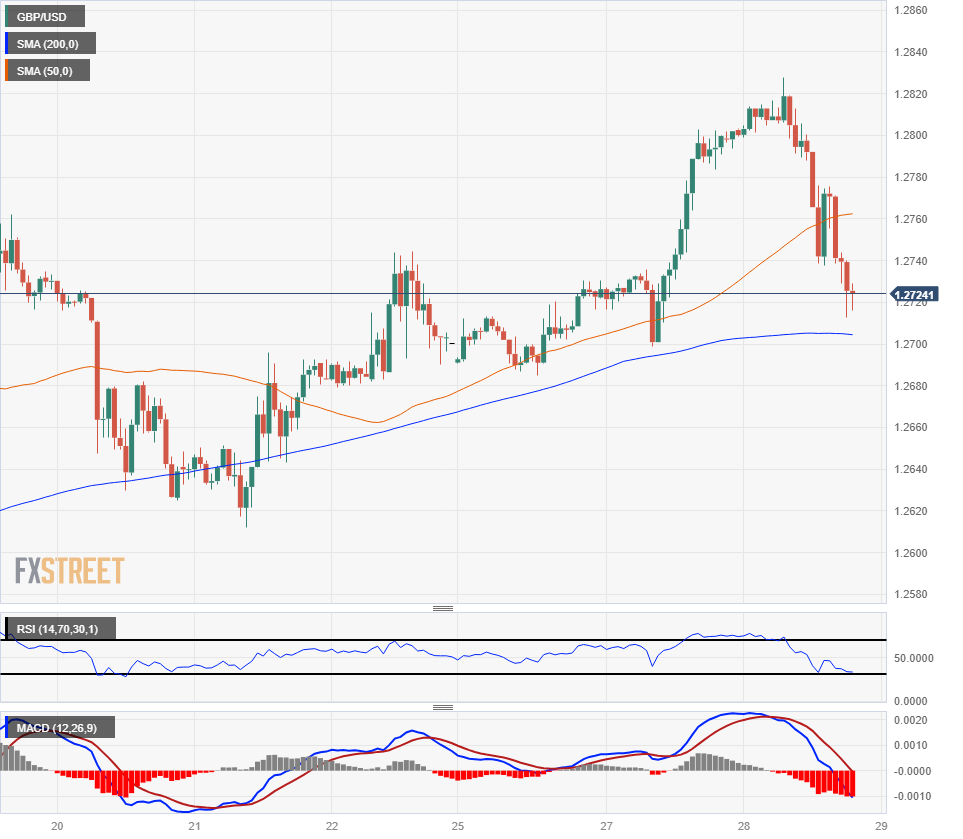
Thursday’s decline in the GBP/USD drags the pair down from multi-month highs near 1.2830 back towards the 200-hour Simple Moving Average (SMA) near the 1.2700 handle, just above a familiar near-term support zone from 1.2700 to 1.2690.
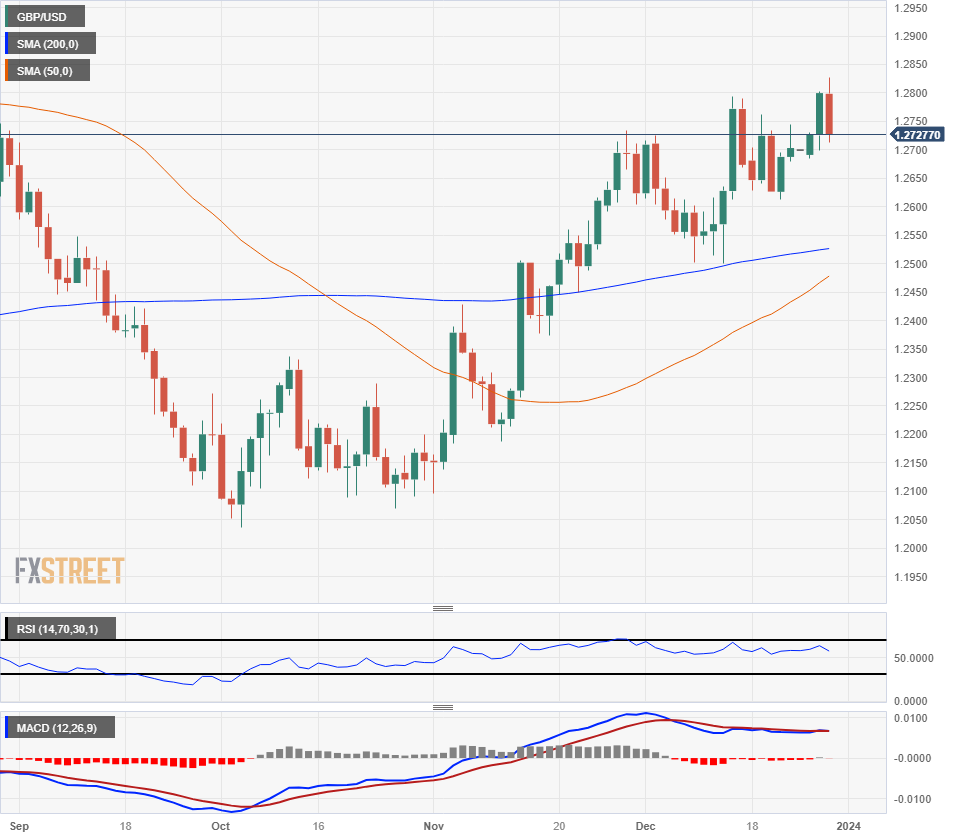
Daily candlesticks have the GBP/USD at risk of tumbling back into familiar price level as intraday bids dip back into a familiar technical zone near the 1.2700 handle, and the medium-term price floor is sitting at the 200-day SMA above the 1.2500 major handle.
GBP/USD Hourly Chart
GBP/USD Daily Chart
GBP/USD Technical Levels
Author

Joshua Gibson
FXStreet
Joshua joins the FXStreet team as an Economics and Finance double major from Vancouver Island University with twelve years' experience as an independent trader focusing on technical analysis.


