|
GBP/USD technical analysis: Small correction up above 1.2600 on USD weakness
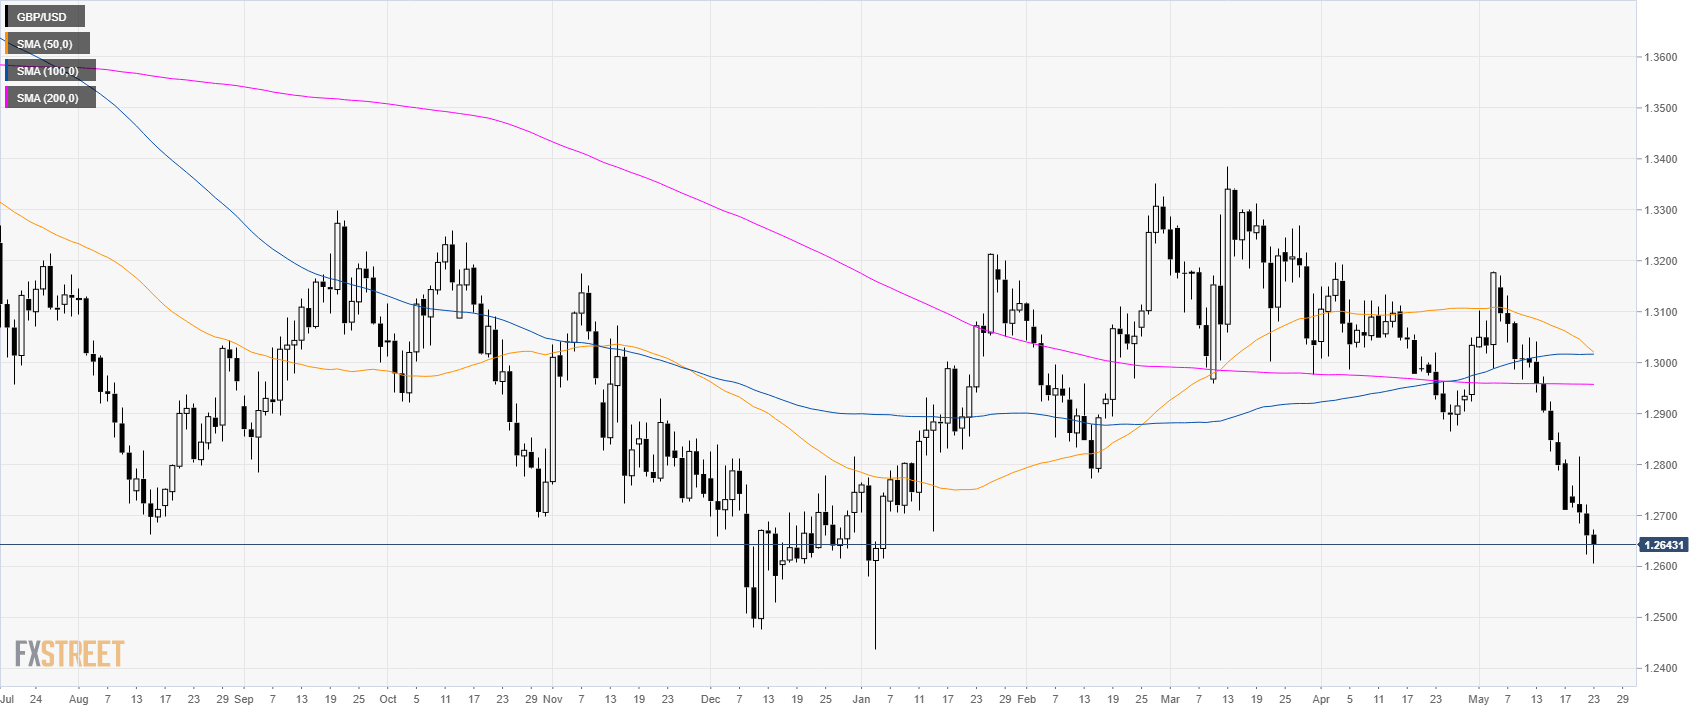
GBP/USD daily chart
GBP/USD has been under extreme selling pressure in the last weeks of trading.
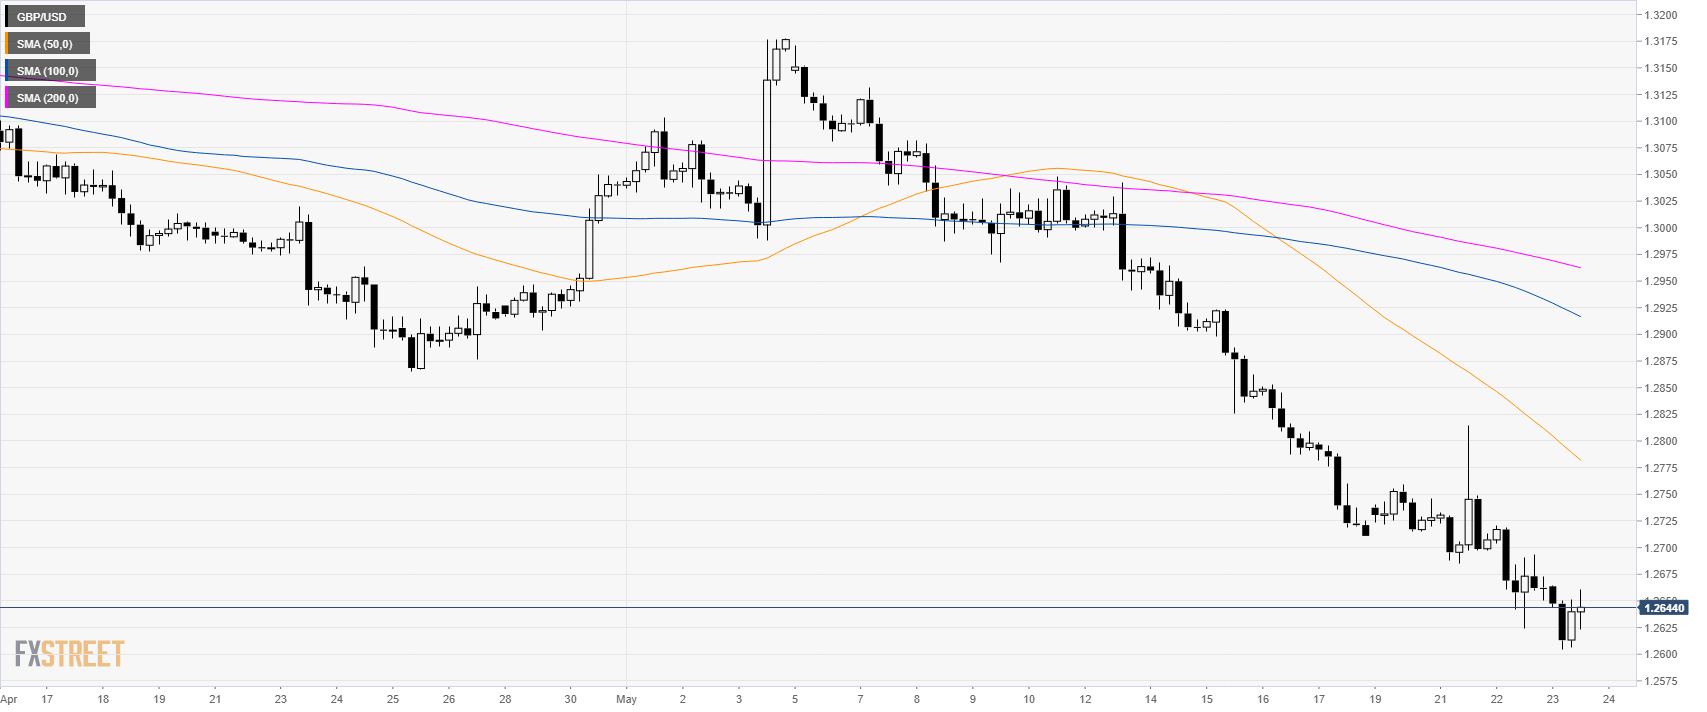
GBP/USD 4-hour chart
GBP/USD is trading below its main simple moving averages a suggesting bearish bias in the near term.
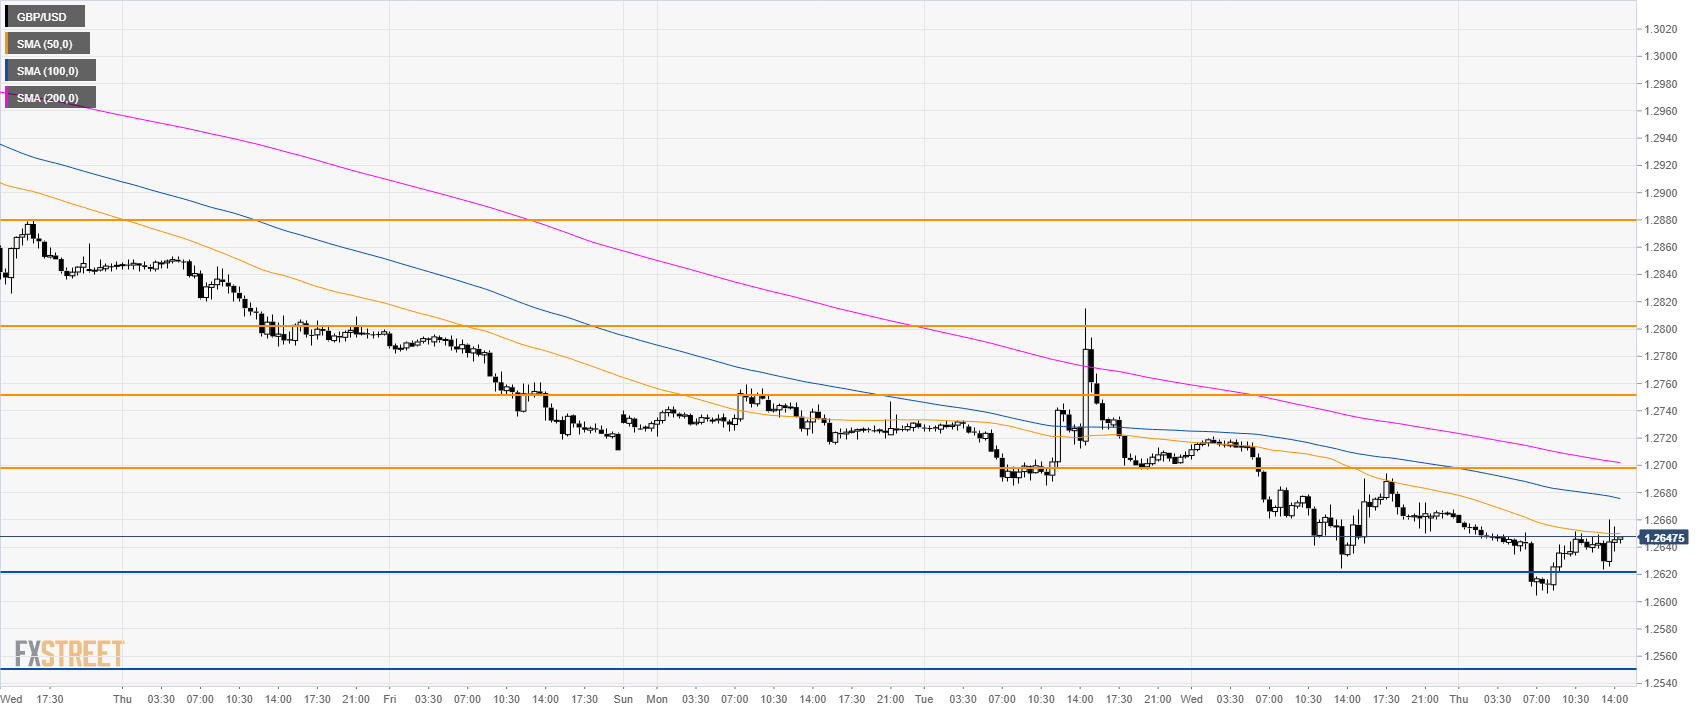
GBP/USD 30-minute chart
GBP/USD is trading below its main SMAs suggesting a bearish bias in the short term. As the USD is slightly weaker across the board bulls are attempting a recovery above 1.2600 figure. The trend remains down and bulls would need to initially break 1.2700 to create a meaningful recovery. With the USD slightly weaker it remains to be seen if bears can continue to drive the currency pair to new lows below 1.2600 figure this Thursday.
Additional key levels
Author

Flavio Tosti
Independent Analyst
More from Flavio Tosti


