|

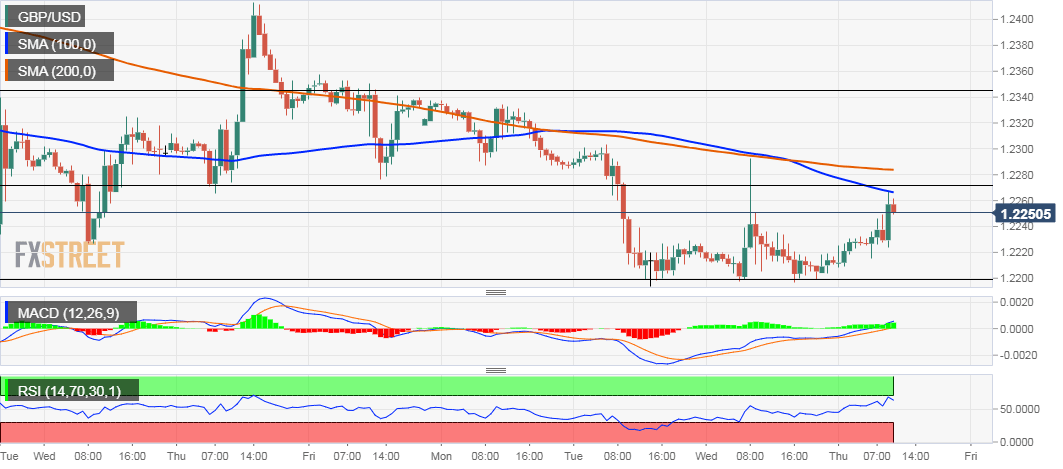
GBP/USD technical analysis: Refreshes session tops, near 100-hour SMA/50% Fibo. confluence region

  • The pair continues to show some resilience near 61.8% Fibo. level.
  • Bulls await a sustained move beyond the overnight swing high.

The GBP/USD pair once again showed some resilience below the 1.2200 round-figure mark on Thursday and witnessed a solid rebound from support marked by 61.8% Fibonacci level of the 1.1958-1.2583 recent strong move up. The intraday buying interest picked up some pace in the last hour and lifted the pair to fresh session tops, levels beyond mid-1.2200s.
 
The mentioned region coincides with 50% Fibo. level and is closely followed by 200-hour SMA near the 1.2285 region – overnight swing high. A sustained move beyond the mentioned barriers might be seen as a key trigger for bullish traders and set the stage for a further intraday appreciating move towards 38.2% Fibo. level resistance – around the 1.2345 region.
 
Meanwhile, technical indicators on the 1-hourly chart have been scaling higher and also recovered from the negative territory on the 4-hourly chart, reinforcing the intraday bullish bias. However, oscillators on the daily chart maintained their bearish bias and warrant some caution before placing any aggressive bullish bets amid persistent Brexit-related uncertainties.
 
Alternatively, rejection slide from the current resistance area, leading to a subsequent slide below the 1.2235 horizontal zone might now accelerate the slide back towards the 1.2200 handle. Failure to defend the mentioned 61.8% Fibo. level support might inspire bears to drag the pair further towards the 1.2160 intermediate support ahead of the 1.2110-1.2100 region.

GBP/USD 1-hourly chart

fxsoriginal

GBP/USD

Overview
Today last price1.2254
Today Daily Change0.0049
Today Daily Change %0.40
Today daily open1.2205
 
Trends
Daily SMA201.2369
Daily SMA501.2256
Daily SMA1001.2415
Daily SMA2001.2716
 
Levels
Previous Daily High1.2292
Previous Daily Low1.2197
Previous Weekly High1.2414
Previous Weekly Low1.2205
Previous Monthly High1.2583
Previous Monthly Low1.1958
Daily Fibonacci 38.2%1.2233
Daily Fibonacci 61.8%1.2256
Daily Pivot Point S11.2171
Daily Pivot Point S21.2136
Daily Pivot Point S31.2075
Daily Pivot Point R11.2266
Daily Pivot Point R21.2327
Daily Pivot Point R31.2361

Author

Haresh Menghani

Haresh Menghani is a detail-oriented professional with 10+ years of extensive experience in analysing the global financial markets.

More from Haresh Menghani
Share:

Editor's Picks

EUR/USD remains offered below 1.1600, seems vulnerable near multi-month low

The EUR/USD pair struggles to capitalize on the overnight bounce from the 1.1530 region, or the lowest level since November 2025, and lower for the third consecutive day on Wednesday. Spot prices slide back below the 1.1600 mark during the Asian session and seem vulnerable to slide further.

GBP/USD slips below key averages as geopolitical risks mount

GBP/USD fell about 0.35% on Tuesday, settling around 1.3350 after slipping below the 200-day Exponential Moving Average for the first time since early December. The pair has pulled back sharply from its late-January high near 1.3870, shedding over 500 pips in a series of lower highs and lower lows. 

Gold rebounds ahead of US ADP, will it last?

Gold finds renewed Asian bids and retests $5,230 early Wednesday after the heavy sell-off on Tuesday. The US Dollar stands tall amid escalating Middle East tensions and reduced dovish Fed expectations. Gold defends $5,000 or 50% Fibo level after facing rejection at the 78.6% Fibo resistance at $5,342 amid bullish RSI.  

Ethereum: Whales step up buying as short positions contract

After holding firm heading into the last weekend, Ethereum whales have returned to action, pouncing on the volatility stemming from escalating military actions between the US and Iran.

Energy shock 2.0: Why rising Gas prices could hit the Euro

Even without a confirmed, sustained disruption, the mere risk to a key global energy chokepoint is enough to inject a significant premium into European Gas markets. And for the Euro, that matters.

Ripple falters amid sell-off jitters and negative funding rates

Ripple (XRP) has come under pressure, drifting lower to $1.35 at the time of writing on Tuesday. The over 2% correction looks poised to erase the previous day’s gains, which lifted the remittance token to $1.42.