GBP/USD technical analysis: Oversold RSI favors pullbacks to previous support-line
- GBP/USD seesaws near multi-month low but refrains from breaking 1.2000 round-figure.
- Oversold RSI increases the odds for the pair’s pullback to five-month-old descending trend-line.
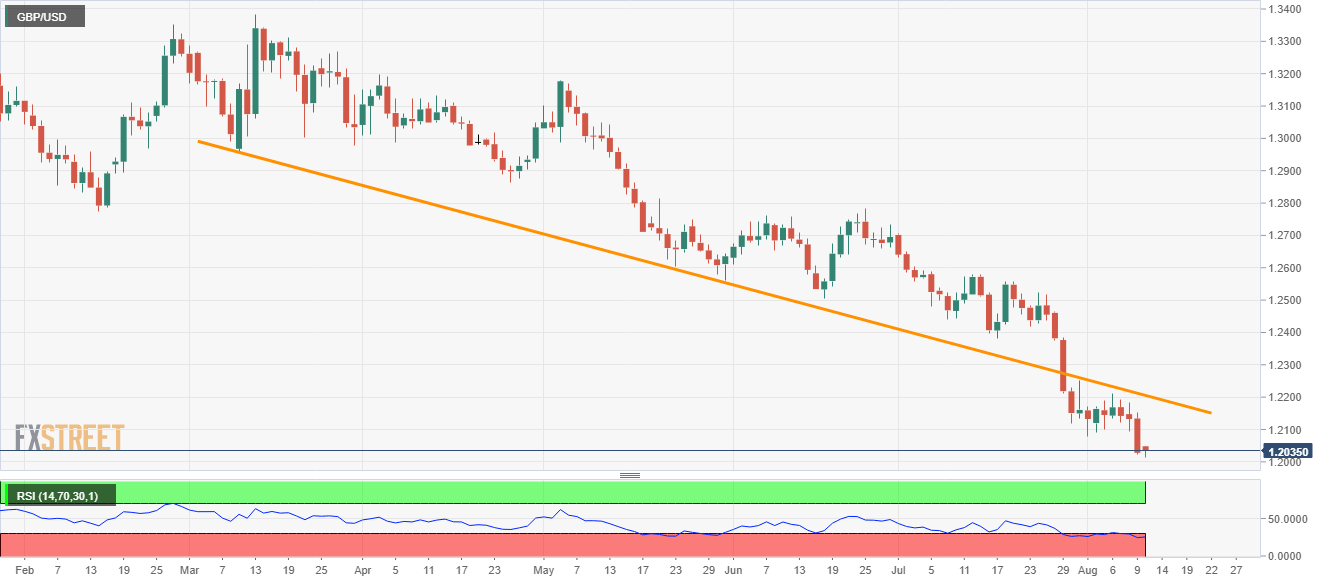
Despite trading near the lowest levels since early 2017, GBP/USD refrains from further downside as it makes the rounds to 1.2035 while heading into the UK open on Monday.
Against the price momentum is the 14-bar relative strength index (RSI) that increases the odds for a pullback towards five-month-old resistance-line (previous support) at 1.2205. However, a sustained break of August 01 low near 1.2080 becomes necessary to initiate the recovery.
In a case where the quote rallies past-1.2205, July 17 low near 1.2382 will be on the buyer’s radar.
Meanwhile, a downside break of 1.2000 mark can look a validation from 2017 low near 1.1987 ahead of pleasing bears with 2016 bottom surrounding 1.1806.
GBP/USD daily chart
Trend: Pullback expected
Author

Anil Panchal
FXStreet
Anil Panchal has nearly 15 years of experience in tracking financial markets. With a keen interest in macroeconomics, Anil aptly tracks global news/updates and stays well-informed about the global financial moves and their implications.


