|

GBP/USD technical analysis: Largest two-day advance since 2016 on Brexit optimism, off 1.2700 handle

  • EU27 tunnel negotiations with the United Kingdom sparks 200-pip spike on Cable. 
  • In the New York session, GBP/USD is easing from the 1.2700 handle. 
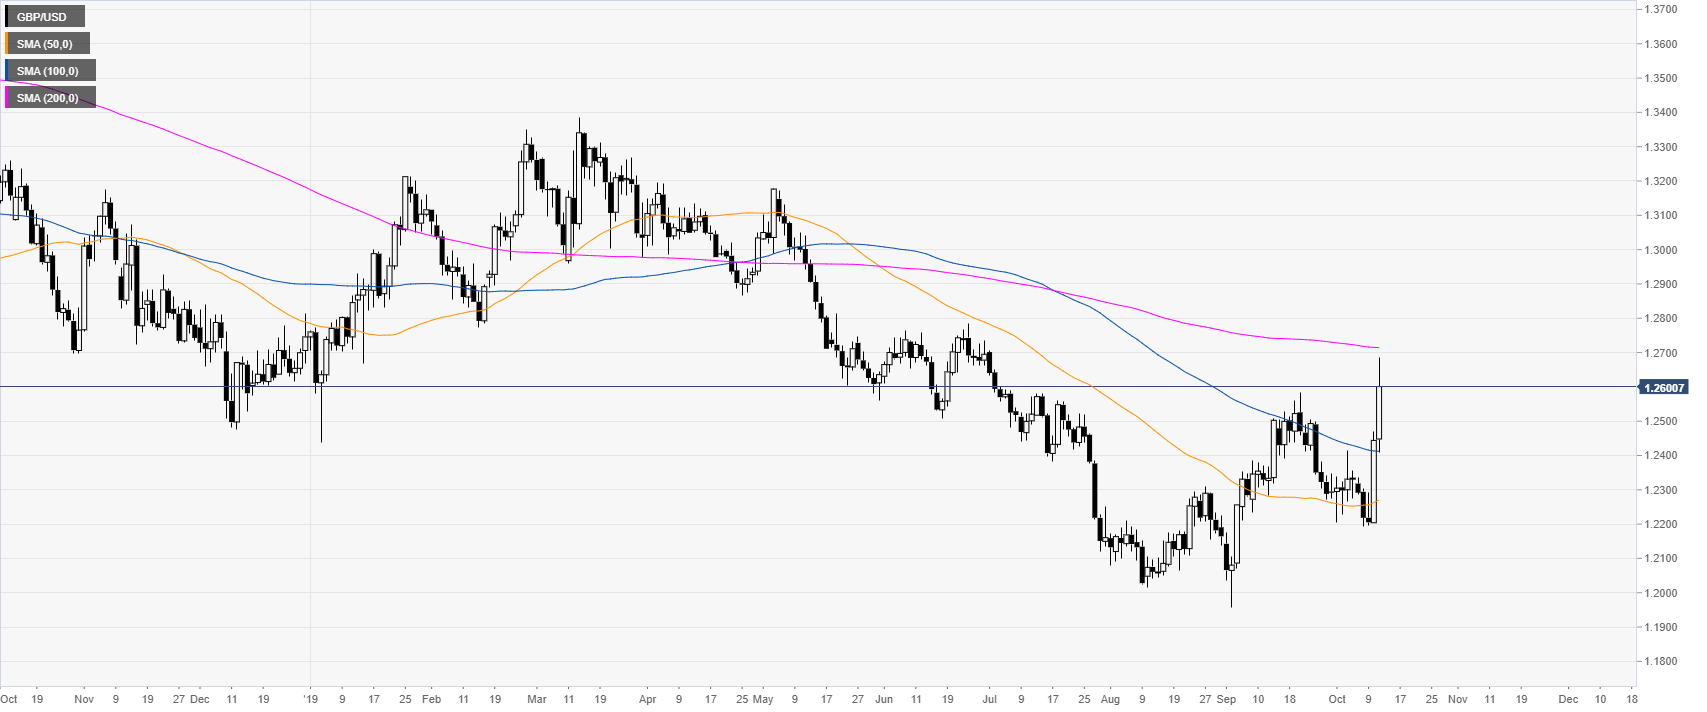
 

GBP/USD daily chart


The Cable, on the daily chart, is trading in a bear trend below its 200-day simple moving average (DSMA). GBP/USD is up nearly 500 pips from the October lows, as the Cable is on track to its largest two-day rally since 2016. The last leg up is attributed to EU’s Chief Brexit Negotiator Barnier having the green light from the EU27 for tunnel negotiations with the United Kingdom.


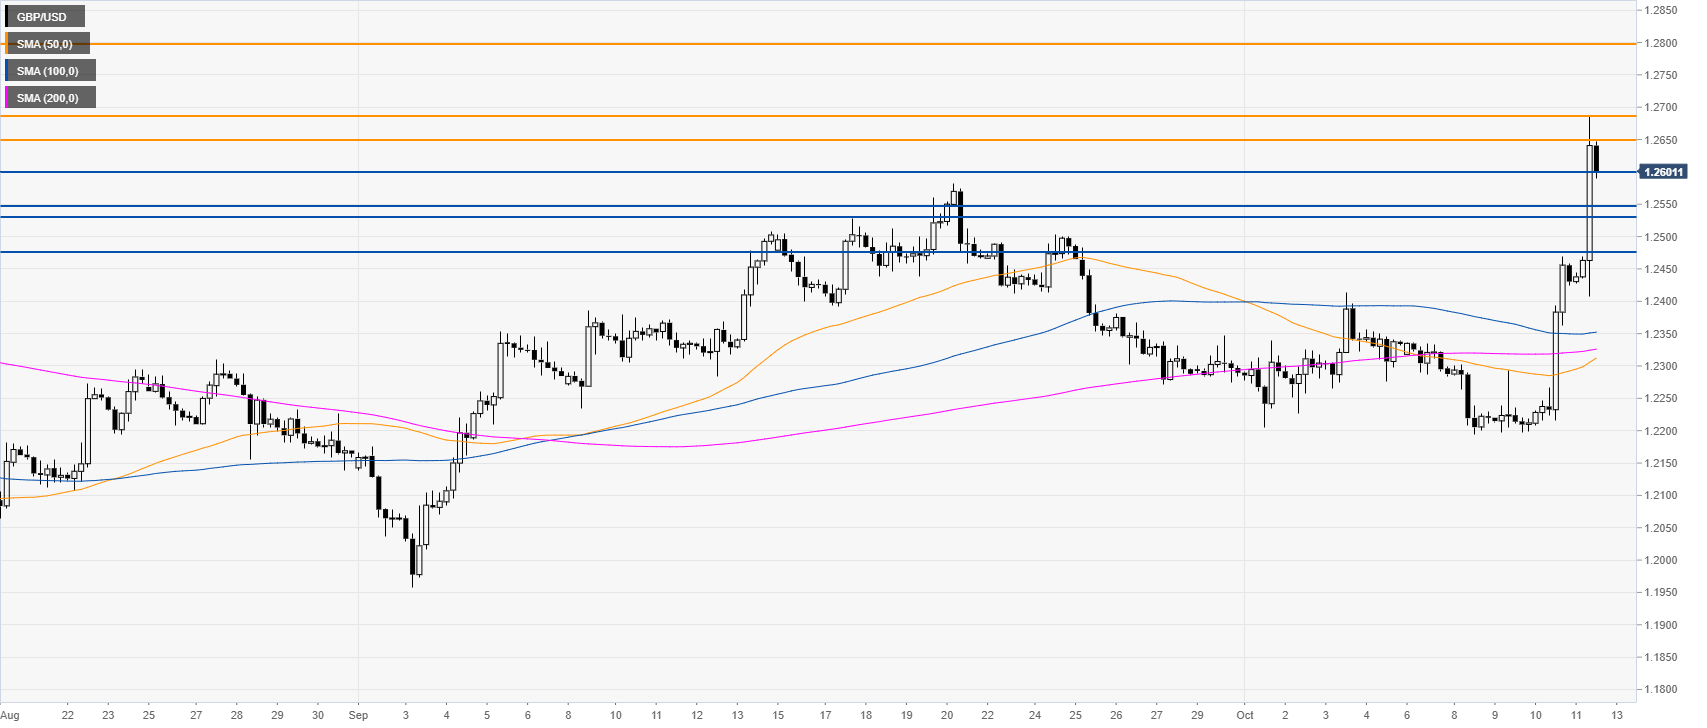
GBP/USD four-hour chart

 
GBP/USD got another leg up worth about 200 pips. The market is currently consolidating the spike below the 1.2700 handle. If the market break above this level the newt stop can become the 1.2800 figure. 
 

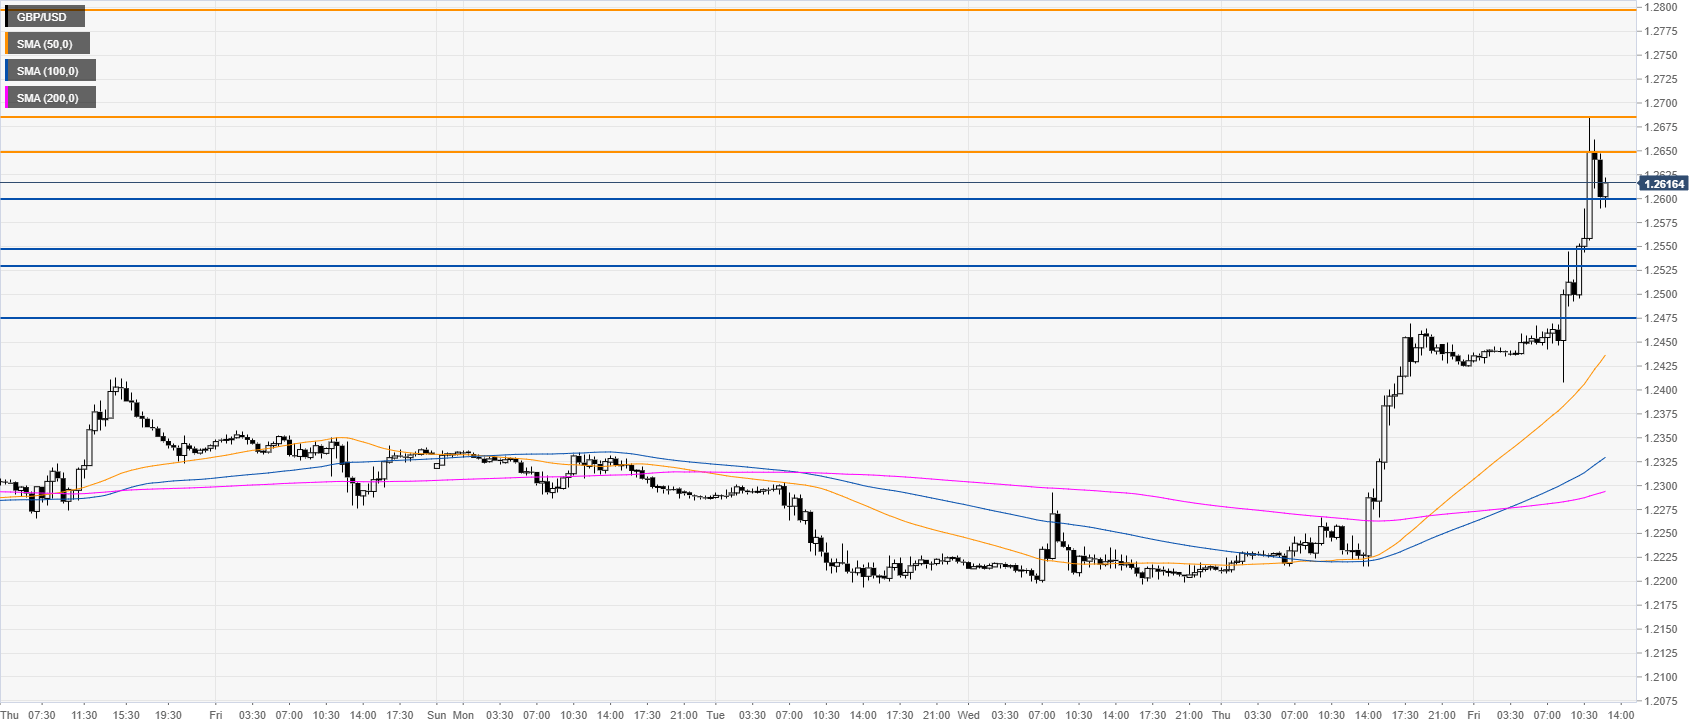
 GBP/USD 30-minute chart


The Pound is trading above the main SMAs, suggesting bullish momentum in the near term. Support is seen at the 1.2600, 1.2543/30 zone and the 1.2477 level, according to the Technical Confluences Indicator


Additional key levels

GBP/USD

Overview
Today last price1.2609
Today Daily Change0.0165
Today Daily Change %1.33
Today daily open1.2444
 
Trends
Daily SMA201.2375
Daily SMA501.2262
Daily SMA1001.2413
Daily SMA2001.2715
 
Levels
Previous Daily High1.247
Previous Daily Low1.2204
Previous Weekly High1.2414
Previous Weekly Low1.2205
Previous Monthly High1.2583
Previous Monthly Low1.1958
Daily Fibonacci 38.2%1.2368
Daily Fibonacci 61.8%1.2305
Daily Pivot Point S11.2275
Daily Pivot Point S21.2107
Daily Pivot Point S31.201
Daily Pivot Point R11.2541
Daily Pivot Point R21.2638
Daily Pivot Point R31.2806

Author

Flavio Tosti

Flavio Tosti

Independent Analyst


More from Flavio Tosti
Share:

Editor's Picks

EUR/USD holds steady above 1.1850 in quiet session

EUR/USD stays defensive but holds 1.1850 amid quiet markets in the European hours on Monday.  The US Dollar is struggling for direction due to thin liquidity conditions as US markets are closed in observance of Presidents' Day holiday. 

GBP/USD flat lines near 1.3650 ahead of UK and US data

GBP/USD kicks off a new week on a subdued note and oscillates in a narrow range near 1.3650 on Monday. The mixed fundamental backdrop warrants some caution for aggressive traders as the market focus now shifts to this week's important data releases from the UK and the US.

Gold corrects lower, tries to stabilize above $5,000

Gold started the week under bearish pressure and declined to the $4,960 area before staging a modest rebound. As trading volumes remain thin with the US financial markets remaining closed on Presidents' Day holiday, XAU/USD looks to stabilize above $5,000 ahead of this week's key data releases.

Bitcoin consolidates as on-chain data show mixed signals

Bitcoin price has consolidated between $65,700 and $72,000 over the past nine days, with no clear directional bias. US-listed spot ETFs recorded a $359.91 million weekly outflow, marking the fourth consecutive week of withdrawals.

The week ahead: Key inflation readings and why the AI trade could be overdone

It is likely to be a quiet start to the week, with US markets closed on Monday for Presidents Day. European markets are higher across the board and gold is clinging to the $5,000 level after the tamer than expected CPI report in the US reduced haven flows to precious metals.

Monero Price Forecast: XMR risks a drop below $300 under mounting bearish pressure

Monero (XMR) starts the week under pressure, recording a 4% decline at press time on Monday after a 7% drop the previous day, putting the $300 support zone in focus.