|
GBP/USD technical analysis: Intraday rollercoaster settles near the 1.2135 level
- GBP/USD bear trend remains for the moment intact.
- The levels to beat for bears are seen at 1.2135 and 1.2082 supports.

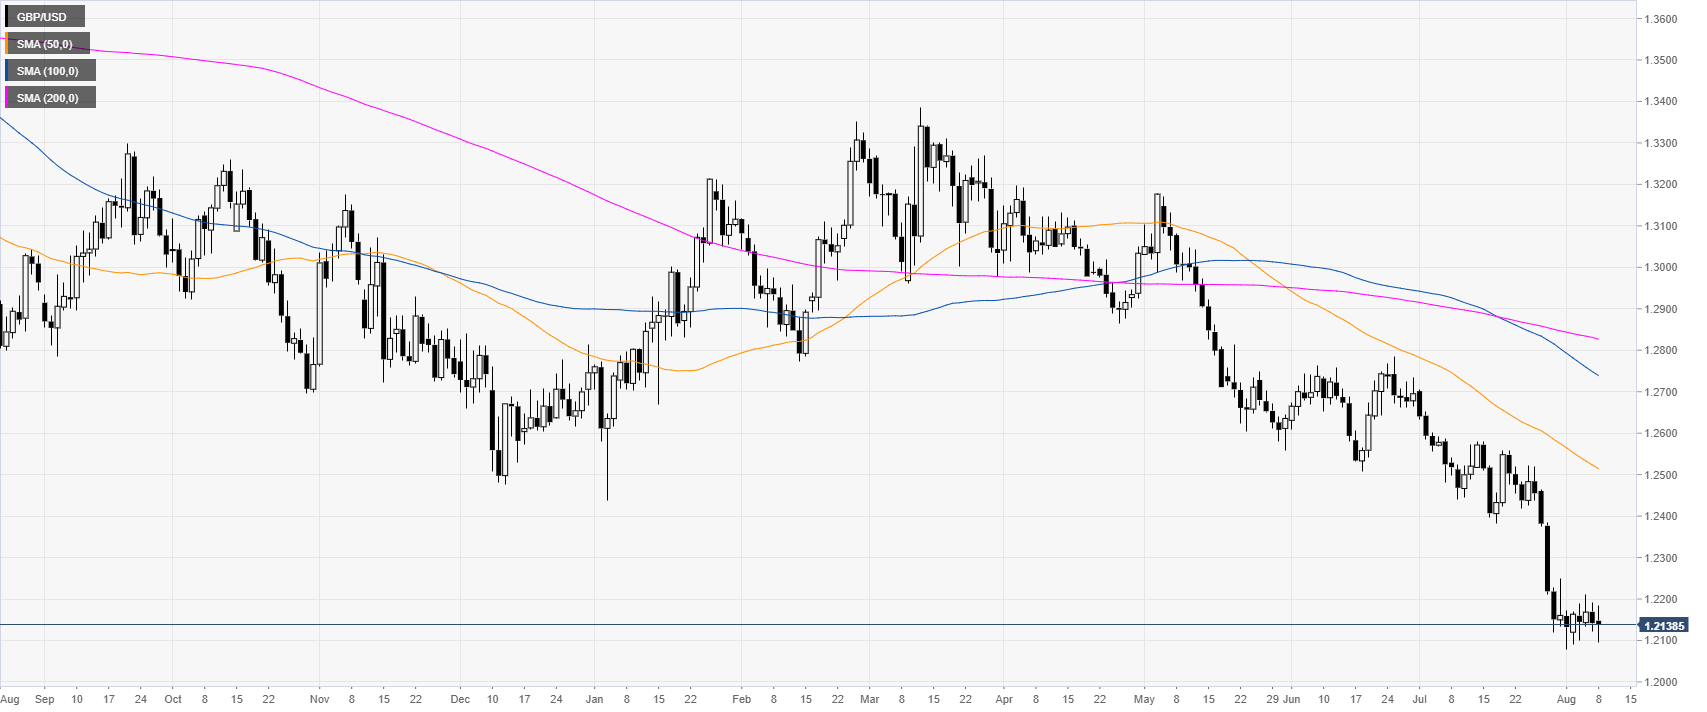
GBP/USD daily chart
Cable is under bearish pressure near multi-month lows as the market is trading below its main daily simple moving averages (DSMAs).
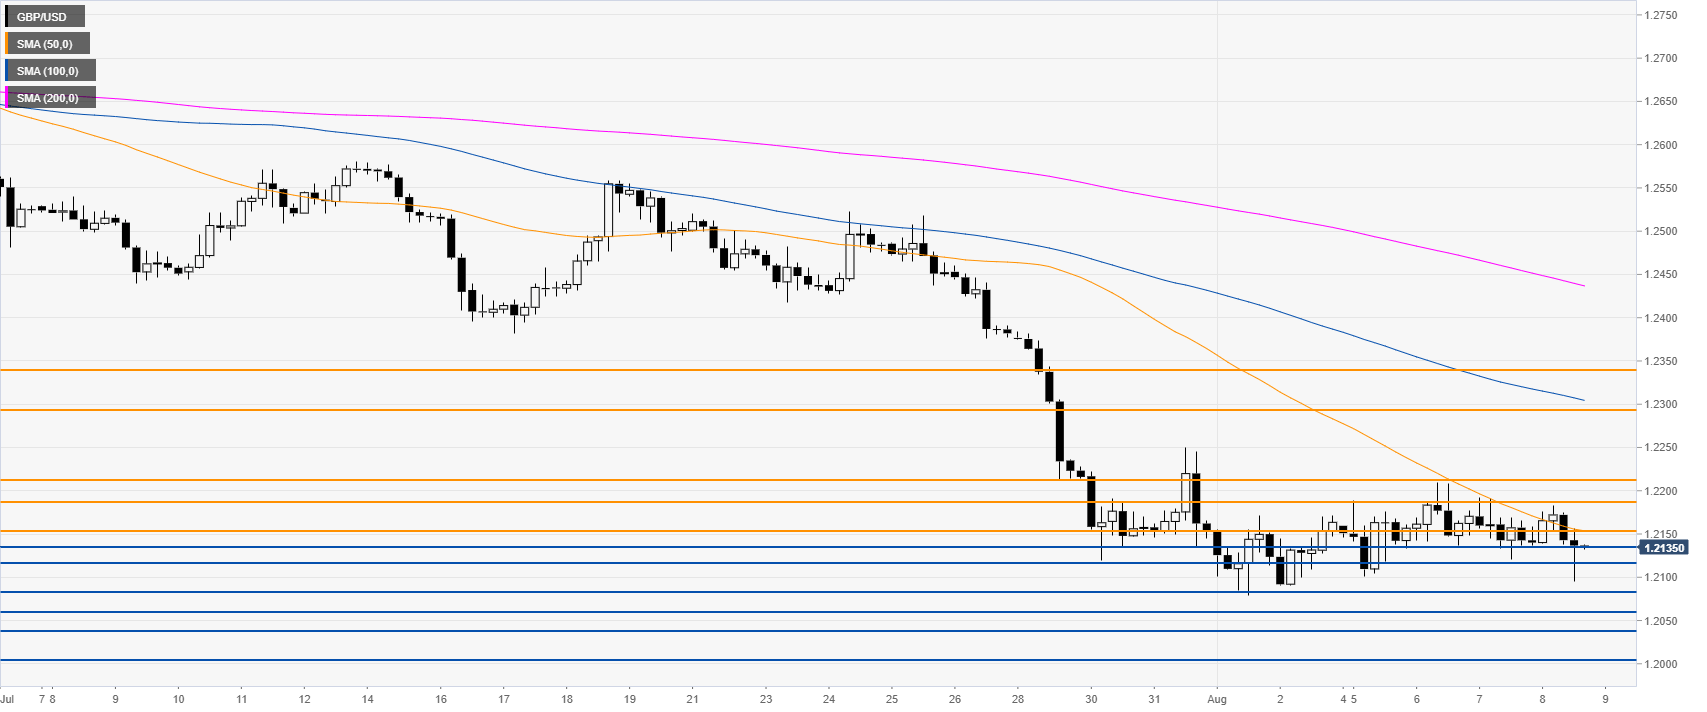
GBP/USD 4-hour chart
GBP/USD is trading below its main SMAs, suggesting bearish momentum in the near term. Bears attempted to break below the 1.2116 support in the New York session. A clear break below this level is necessary for the market to depreciate towards 1.2082, 1.2060, 1.2035 and the 1.2000 figure, according to the Technical Confluences Indicator.
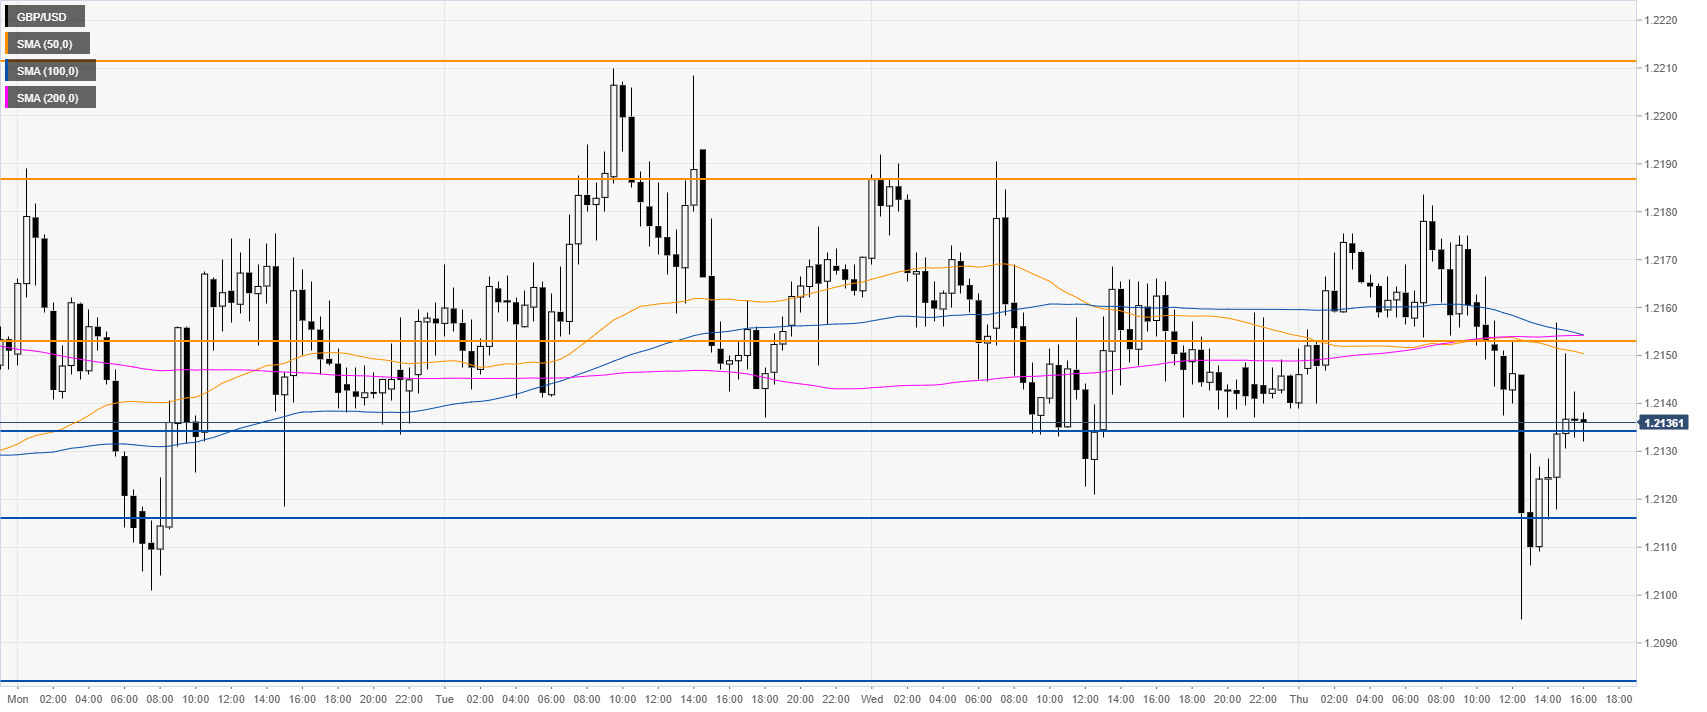
GBP/USD 30-minute chart
Cable is volatile this Thursday as the market had a sharp reaction up from the daily lows. Spot is settling in the 1.2135-1.2154 range as the London session comes to an end. Immediate resistance can be seen near 1.2154, 1.2186 and the 1.2212 levels.
Additional key levels
Author

Flavio Tosti
Independent Analyst
More from Flavio Tosti


