|

GBP/USD Technical Analysis: holding into bullish pressure despite risk flows

  • The Sterling is looking for higher gains as Brexit hopes push traders into the bullish camp.
  • With trade wars beginning to ramp-up, buying pressure is going to face severe headwinds.
  • The economic calendar remains thin until Wednesday's inflation reading for the UK, leaving buyers to look up towards the 200-day EMA slung high above current prices.

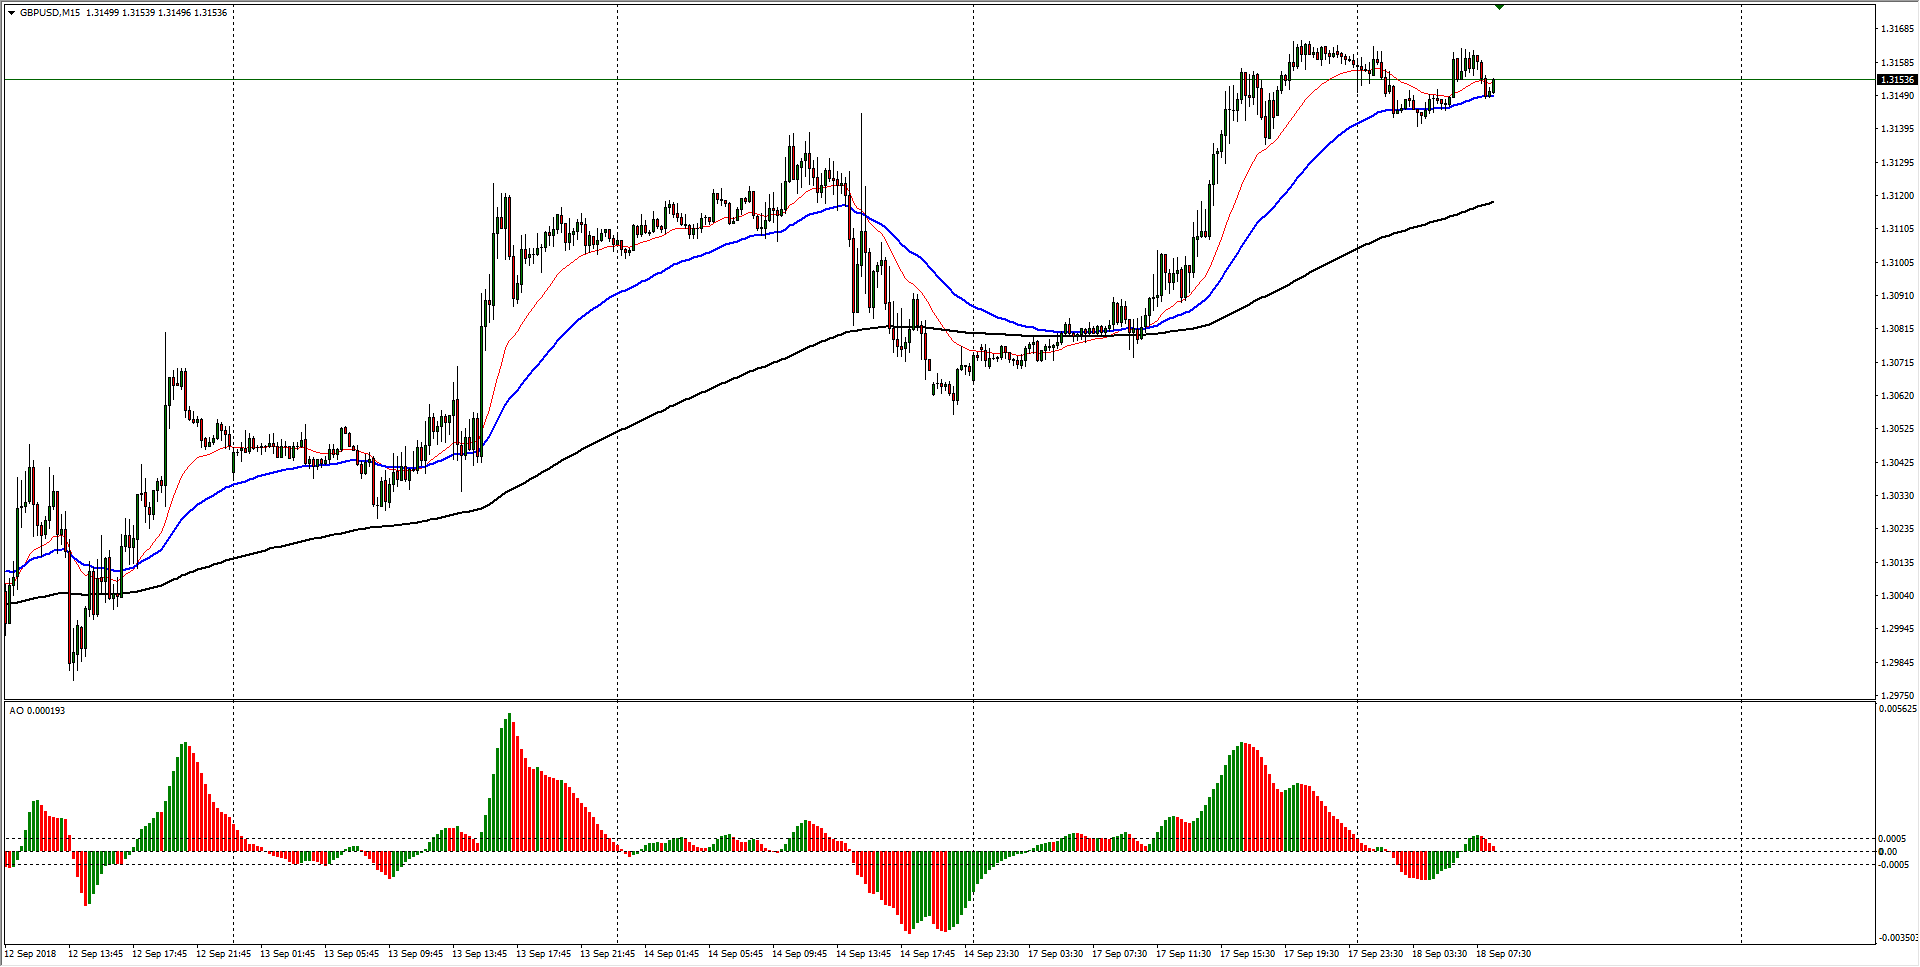
GBP/USD Chart, 15-Minute

Spot rate1.3153
Relative changeNegligible
High1.3163
Low1.3140
  
TrendSideways to bullish
  
Support 11.3066 (previous day low)
Support 21.3040 (200-hour EMA)
Support 31.3029 (50-day EMA)
  
Resistance 11.3165 (previuos day high)
Resistance 21.3213 (July 26th swing high)
Resistance 31.3296 (200-day EMA)

Author

Joshua Gibson

Joshua joins the FXStreet team as an Economics and Finance double major from Vancouver Island University with twelve years' experience as an independent trader focusing on technical analysis.

More from Joshua Gibson

Share:

Editor's Picks

GBP/USD advaces beyond 1.3450 after BoE decision, US Q2 GDP

GBP/USD gains positive momentum on Thursday, surpassing 1.3450 and trading at fresh multi-week highs. The Bank of England decided to maintain the benchmark rate unchanged at 3.75%. The MPC voted 6-3 to keep rates on hold, with the 3 dissenters favoring a rate hike. US Q2 GDP missing expectations helped the pair advance, while renewed US Dollar weakness across the FX board pushed the pair further up ahead of the monthly close.

EUR/USD confortable around 1.1530, highest in six weeks

The EUR/USD pair trades around 1.1530 in the American session on Thursday, reaching fresh six-week highs. The US Dollar is in sell-off mode, with multiple factors weighing on the American currency. Not only did the Federal Reserve vote divided to keep rates on hold on Wednesday, creating doubts about a September hike, but US Q2 GDP missed expectations. A suspected JPY intervention adds pressure on the Greenback.

Gold: Looks to snap four-month losing streak but sellers refuse to give up

Gold fails to hold above $4,100 once again as sellers return early Friday. The US Dollar rebounds on fresh US-Iran tensions and month-end profit-taking. Gold closed above $4,100 on Thursday, but the daily RSI remains below 50.  

Why is IDR near historic lows despite Bank Indonesia's 5.75% rate?

The Indonesian Rupiah has faced persistent depreciation pressures against the US Dollar during the first half of 2026, with the USD/IDR pair stabilizing around the 18,100–18,200 range at the time of writing after reaching a record high at 18,247 on June 8, marking the Rupiah's weakest level on record against the Greenback.

9-3: Is the Federal Reserve’s vote tally Warsh's new forward guidance?
The rate did not move. Neither did the statement, and that’s the more interesting fact. Set the July 29 Federal Open Market Committee (FOMC) statement beside the one issued on June 17, and the two documents are identical apart from a single verb and a paragraph at the bottom naming three dissenters.
9-3: Is the Federal Reserve’s vote tally Warsh's new forward guidance?
The rate did not move. Neither did the statement, and that’s the more interesting fact. Set the July 29 Federal Open Market Committee (FOMC) statement beside the one issued on June 17, and the two documents are identical apart from a single verb and a paragraph at the bottom naming three dissenters.















