|

GBP/USD Technical Analysis: GBP/USD keeps falling and hits a new 2018 low

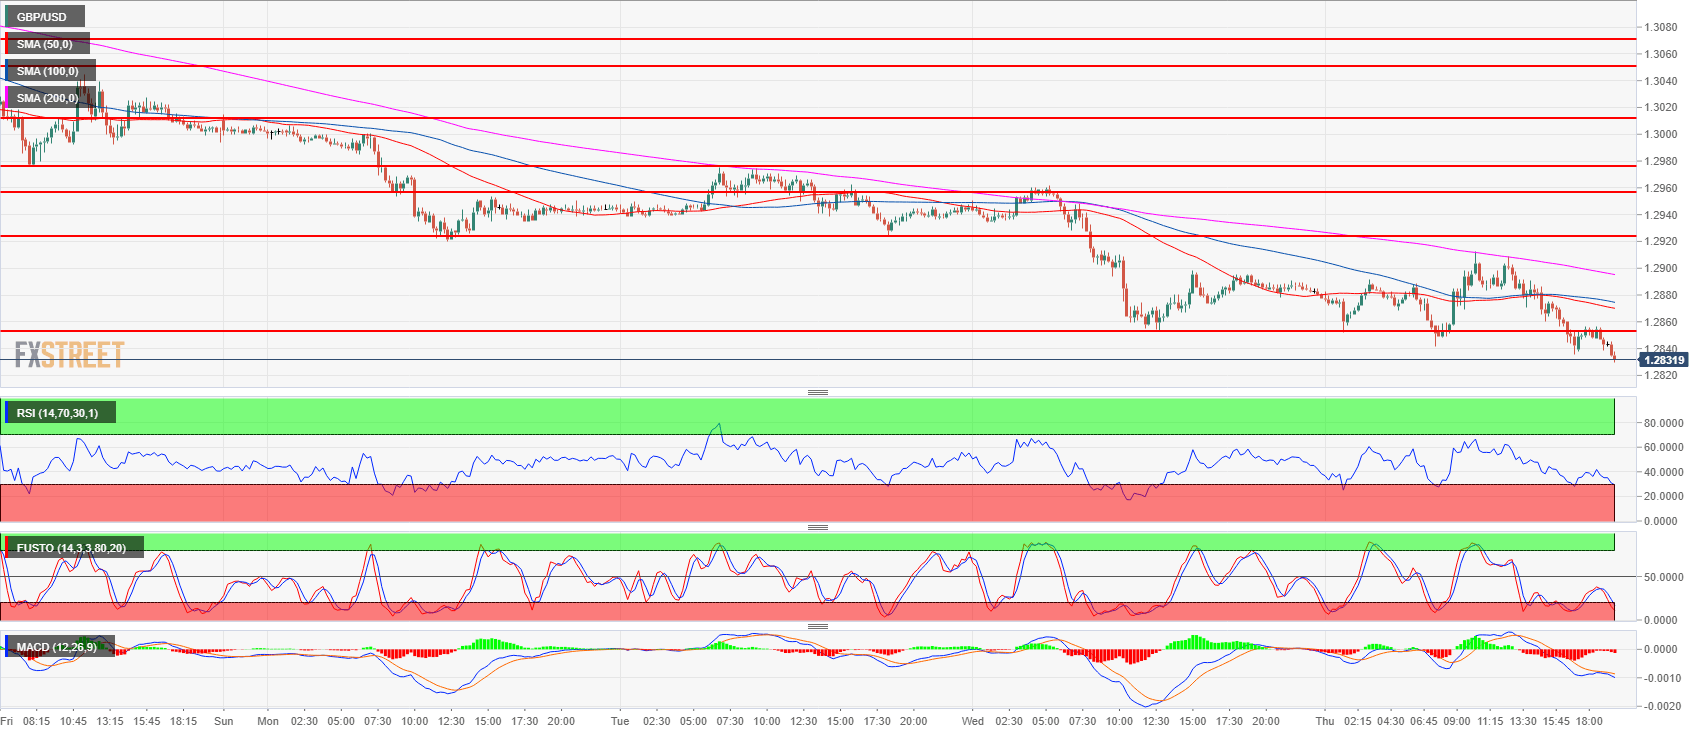
  • GBP/USD has reached a new 2018 low at 1.2826 as the bears are pushing Cable into oversold territories and beyond most trendlines on the daily chart. GBP/USD has now exceeded its average daily range of 82 by 4 pips. 
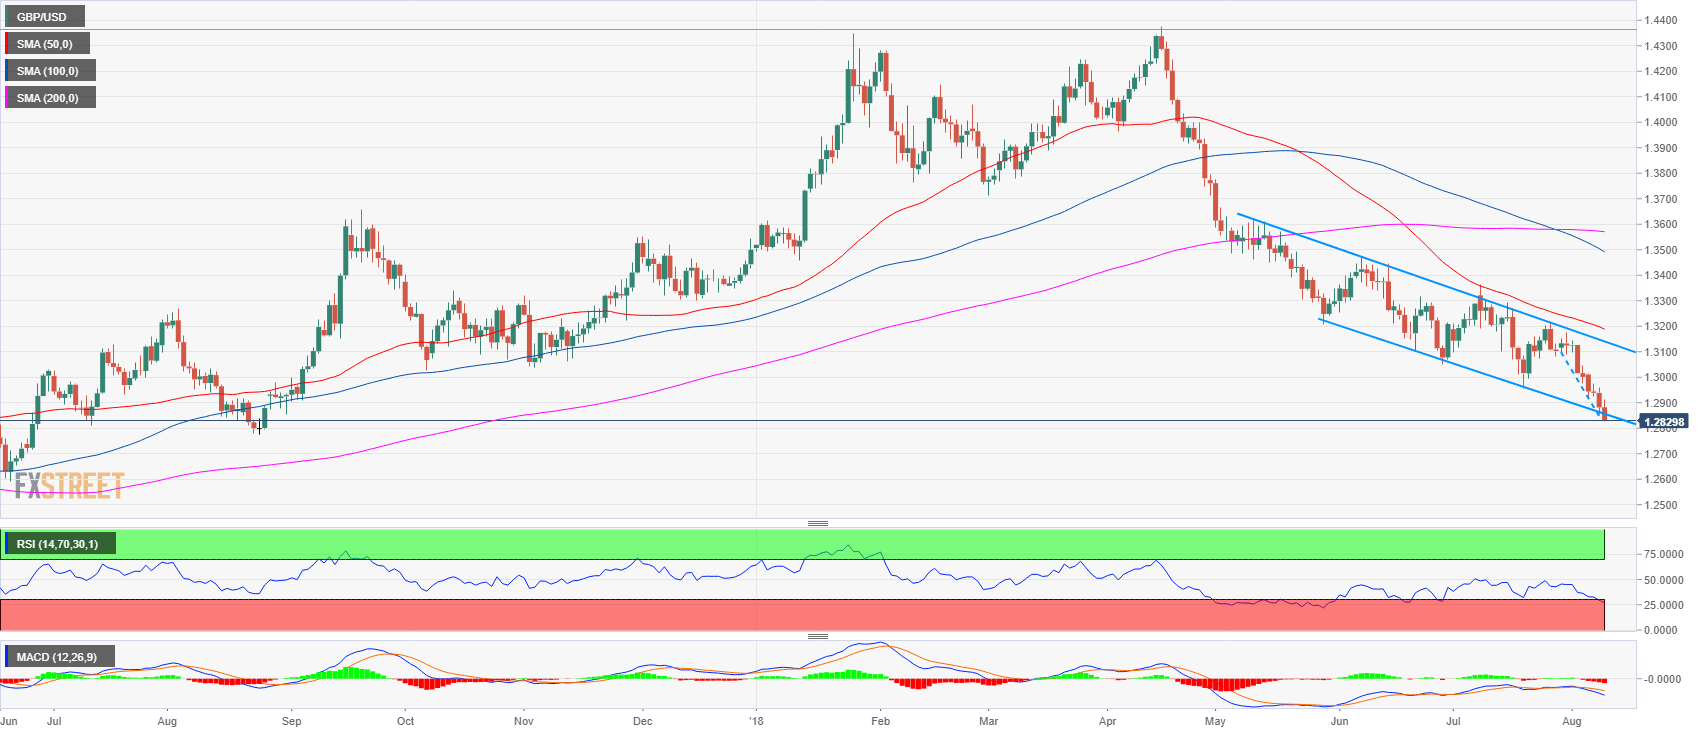
  • GBP/USD bears next targets are likely located near 1.2774 August 24, 2017 low and 1.2700 figure. Bulls will try to create a reversal by first targeting 1.2900-1.2923 area but it will not be an easy task as they have to face strong bearish pressure.

GBP/USD 15-minute chart

b

GBP/USD daily chart

Spot rate:               1.2828
Relative change:    -0.40%     
High:                      1.2912
Low:                       1.2826

Trend:                    Bearish 

Resistance 1:        1.2900-1.2923 area, figure and August 7 low 
Resistance 2:        1.2957 July 17 low
Resistance 3:        1.2975 August 3 low
Resistance 4:        1.3000-1.3010 area, figure and July 18 low
Resistance 5:        1.3049 June 28 low
Resistance 6:        1.3100-1.3076 area, figure and July 24 low
Resistance 7:        1.3155 former breakout point
Resistance 8:        1.3200 figure
Resistance 9:        1.3230 supply level
Resistance 10:       1.3250 June 4 high 

Support 1:             1.2826 August 9, low (2018 low)
Support 2:             1.2774 August 24, 2017 low
Support 3:             1.2700 figure

Author

Flavio Tosti

Flavio Tosti

Independent Analyst


More from Flavio Tosti
Share:

Editor's Picks

EUR/USD holds lower ground near 1.1850 ahead of EU/ US data

EUR/USD remains in the negative territory for the fourth successive session, trading around 1.1850 in European trading on Friday. A broadly cautious market environment paired with modest US Dollar demand undermines the pair ahead of the Eurozone GDP second estimate and the critical US CPI data. 

GBP/USD keeps losses around 1.3600, awaits US CPI for fresh impetus

GBP/USD holds moderate losses at around 1.3600 in the European session on Friday, though it lacks bearish conviction. The US Dollar remains supported amid softer risk tone and ahead of the US consumer inflation figures due later in the NA session on Friday. 

Gold trims intraday gains to $5,000 as US inflation data loom

Gold retreats from the vicinity of the $5,000 psychological mark, though sticks to its modest intraday gains heading into the European session. Traders now look forward to the release of the US consumer inflation figures for more cues about the Fed policy path. The outlook will play a key role in influencing the near-term US Dollar price dynamics and provide some meaningful impetus to the non-yielding bullion.

Solana: Mixed market sentiment caps recovery

Solana is trading at $79 as of Friday, following a correction of over 9% so far this week. On-chain and derivatives data indicates mixed sentiment among traders, further limiting the chances of a price recovery.

A tale of two labour markets: Headline strength masks underlying weakness

Undoubtedly, yesterday’s delayed US January jobs report delivered a strong headline – one that surpassed most estimates. However, optimism quickly faded amid sobering benchmark revisions.

Solana Price Forecast: Mixed market sentiment caps recovery

Solana (SOL) is trading at $79 as of Friday, following a correction of over 9% so far this week. On-chain and derivatives data indicates mixed sentiment among traders, further limiting the chances of a price recovery.