|
GBP/USD Technical Analysis: Cable trapped in a wedge pattern

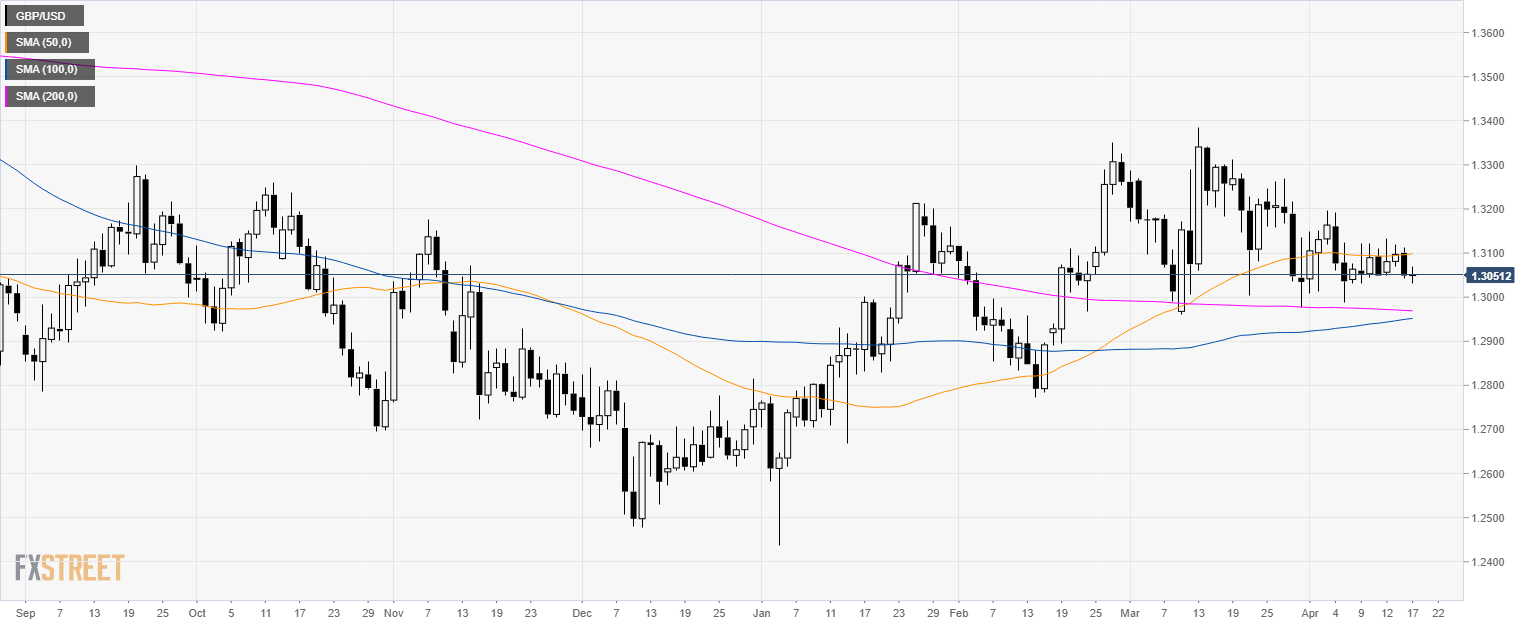
GBP/USD daily chart
- GBP/USD is consolidating below 1.3100 and the 50-day simple moving average (SMA).
GBP/USD 4-hour chart
- GBP/USD is trapped in a wedge pattern.

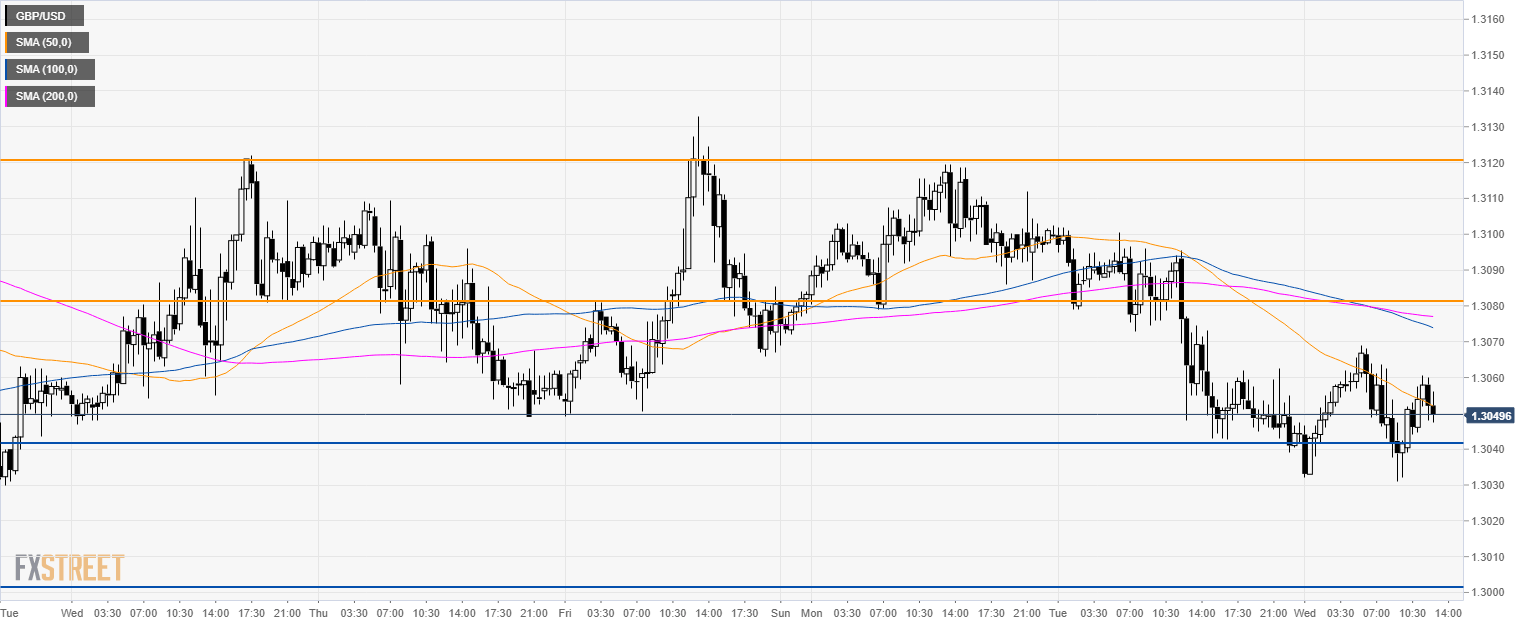
GBP/USD 30-minute chart
- As mentioned yesterday, the market found some support at the 1.3040 level.
- The market might remain in range between 1.3040 and 1.3080 in the New York session.
- Bulls need a break of 1.3080 to reach 1.3120 level while bears need to break below 1.3040 to reach 1.3000 the figure.
Additional key levels
Author

Flavio Tosti
Independent Analyst
More from Flavio Tosti


