|

GBP/USD technical analysis: Cable spikes to 1.2800 on reports of a draft Brexit deal


GBP/USD daily chart


GBP/USD, on the daily chart, is attempting a bullish reversal above the 200-day simple moving average (DSMA). This Tuesday, GBP/USD leaps to 1.2750 on reports of a draft Brexit deal. 
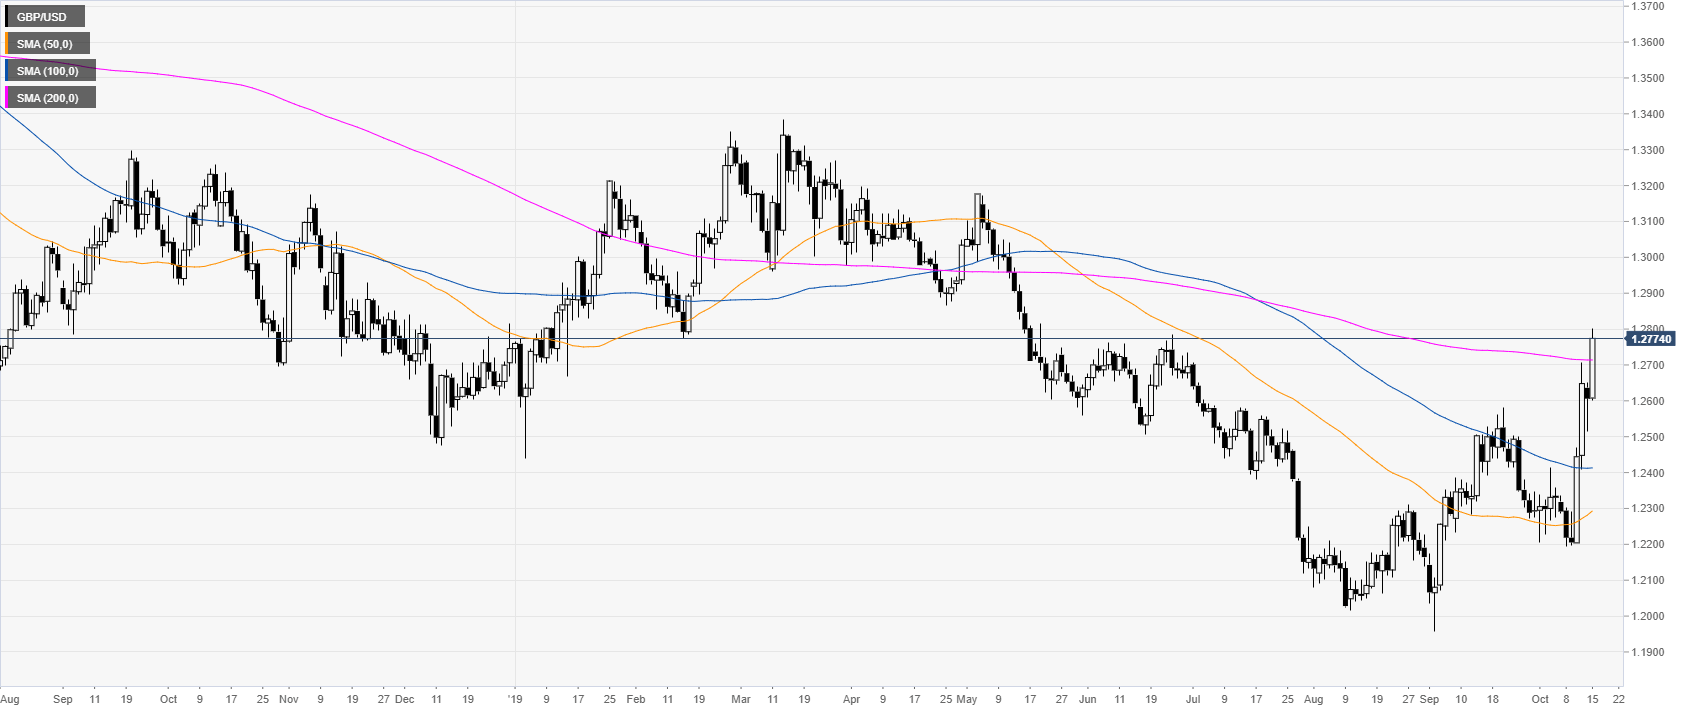


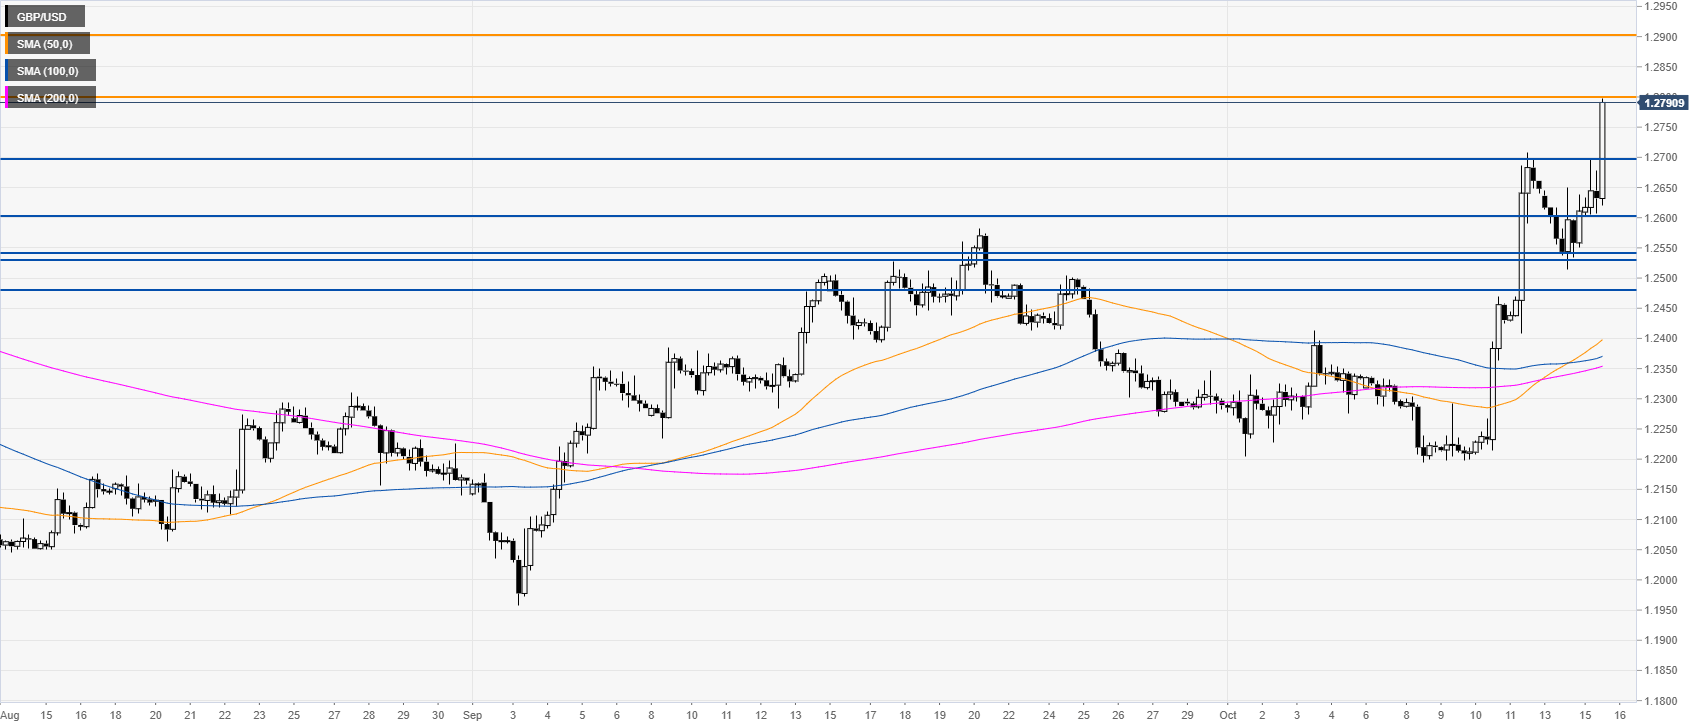
GBP/USD four-hour chart

 
GBP/USD is extending the null move to the 1.2800 handle while trading above its main SMAs. If bulls overcome the 1.2700 figure the next target can be located at the 1.2800 round number. 
  

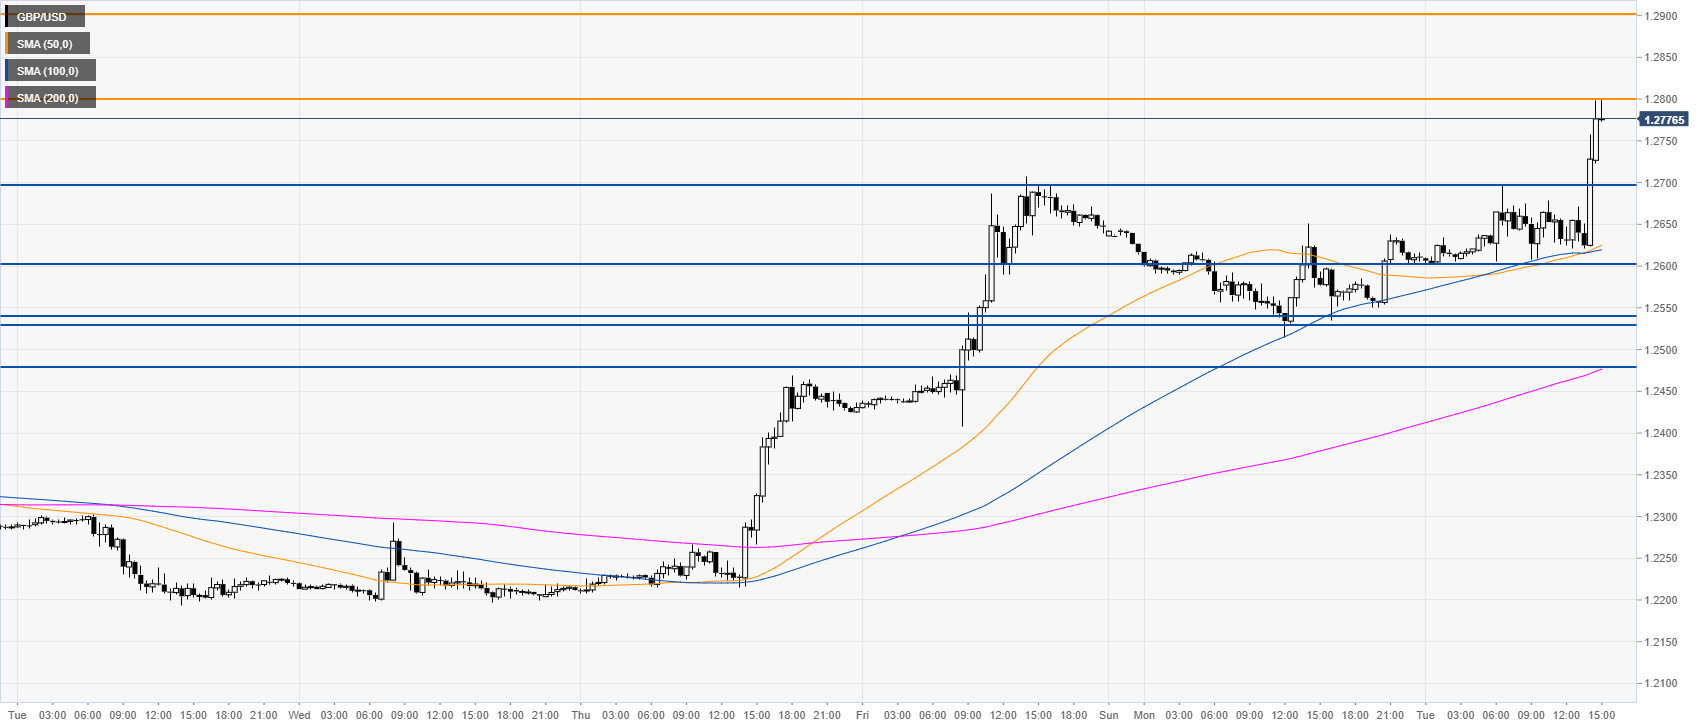
GBP/USD 30-minute chart


The Sterling is trading above the main SMAs, suggesting bullish momentum in the near term. Support is seen at the 1.2700 figure and the 1.2543/30 support zone, according to the Technical Confluences Indicator


Additional key levels

GBP/USD

Overview
Today last price1.2776
Today Daily Change0.0170
Today Daily Change %1.35
Today daily open1.2606
 
Trends
Daily SMA201.2391
Daily SMA501.2281
Daily SMA1001.2412
Daily SMA2001.2714
 
Levels
Previous Daily High1.265
Previous Daily Low1.2515
Previous Weekly High1.2707
Previous Weekly Low1.2194
Previous Monthly High1.2583
Previous Monthly Low1.1958
Daily Fibonacci 38.2%1.2567
Daily Fibonacci 61.8%1.2599
Daily Pivot Point S11.253
Daily Pivot Point S21.2455
Daily Pivot Point S31.2395
Daily Pivot Point R11.2666
Daily Pivot Point R21.2726
Daily Pivot Point R31.2801

Author

Flavio Tosti

Flavio Tosti

Independent Analyst


More from Flavio Tosti
Share:

Editor's Picks

EUR/USD deflates to fresh lows, targets 1.1600

The selling pressure on EUR/USD now gathers extra pace, prompting the pair to hit fresh multi-week lows in the 1.1625-1.1620 band on Friday. The continuation of the downward bias comes in response to further gains in the US Dollar as market participants continue to assess the mixed release of US Nonfarm Payrolls in December.

GBP/USD breaks below 1.3400, challenges the 200-day SMA

GBP/USD remains under heavy fire and retreats for the fourth consecutive day on Friday. Indeed, Cable suffers the strong performance of the Greenback, intensified post-mixed NFP, and trades at shouting distance from its critical 200-day SMA near 1.3380.

Gold flirts with yearly tops around $4,500

Gold keeps its positive bias on Friday, adding to Thursday’s advance and challenging yearly highs in the $4,500 region per troy ounce. The risk-off sentiment favours the yellow metal despite the firmer tone in the Greenback and rising US Treasury yields.

Crypto Today: Bitcoin, Ethereum, XRP risk further decline as market fear persists amid slowing demand

Bitcoin holds $90,000 but stays below the 50-day EMA as institutional demand wanes. Ethereum steadies above $3,000 but remains structurally weak due to ETF outflows. XRP ETFs resume inflows, but the price struggles to gain ground above key support.

Week ahead – US CPI might challenge the geopolitics-boosted Dollar

Geopolitics may try to steal the limelight from US data. A possible US Supreme Court ruling on tariffs could dictate market movements. A crammed data calendar next week, US CPI comes on Tuesday; Fedspeak to intensify.

XRP trades under pressure amid weak retail demand

XRP presses down on the 50-day EMA support as risk-averse sentiment spreads despite a positive start to 2026. XRP faces declining retail demand, as reflected in futures Open Interest, which has fallen to $4.15 billion.