|

GBP/USD technical analysis: Cable off daily lows trading sub-1.2478 in the New York session

  • GBP/USD starts the week by weakening below the 1.2500 figure.
  • The level to beat for bears are at 1.2433 and 1.2388, according to the Technical Confluences Indicator.

GBP/USD daily chart

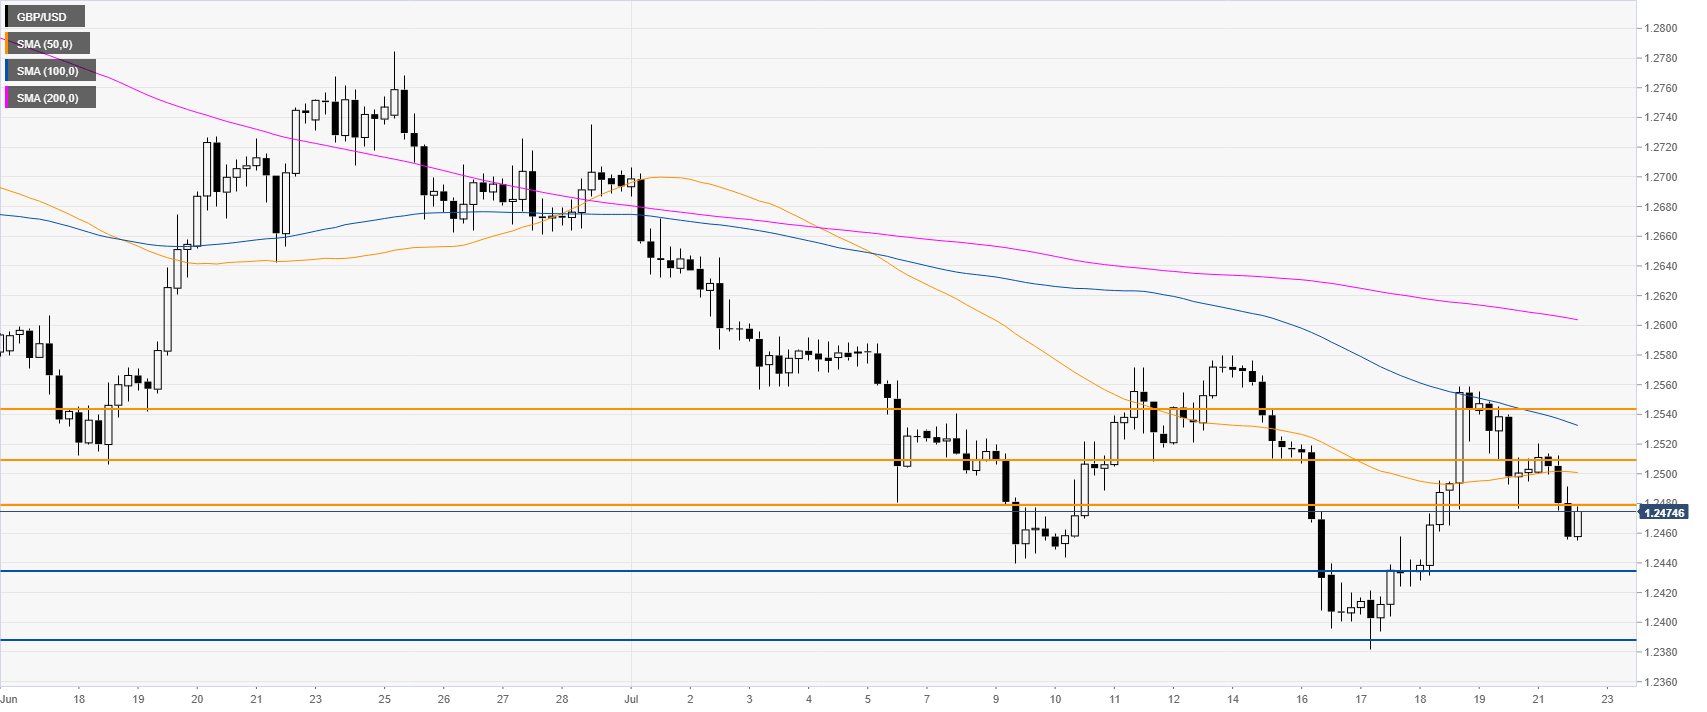
Cable is trading in a bear trend below its main daily simple moving averages (DSMAs). The US Dollar is stronger accross the board as the market is antcipating smaller rate cuts.

GBP/USD 4-hour chart

Cable is trading below the 1.2478 resistance and the main SMAs. If bears break below the current daily low at 1.2455 they could drive the market down towards 1.2433 and 1.2388, according to the Technical Confluences Indicator.
GBP/USD 30-minute chart

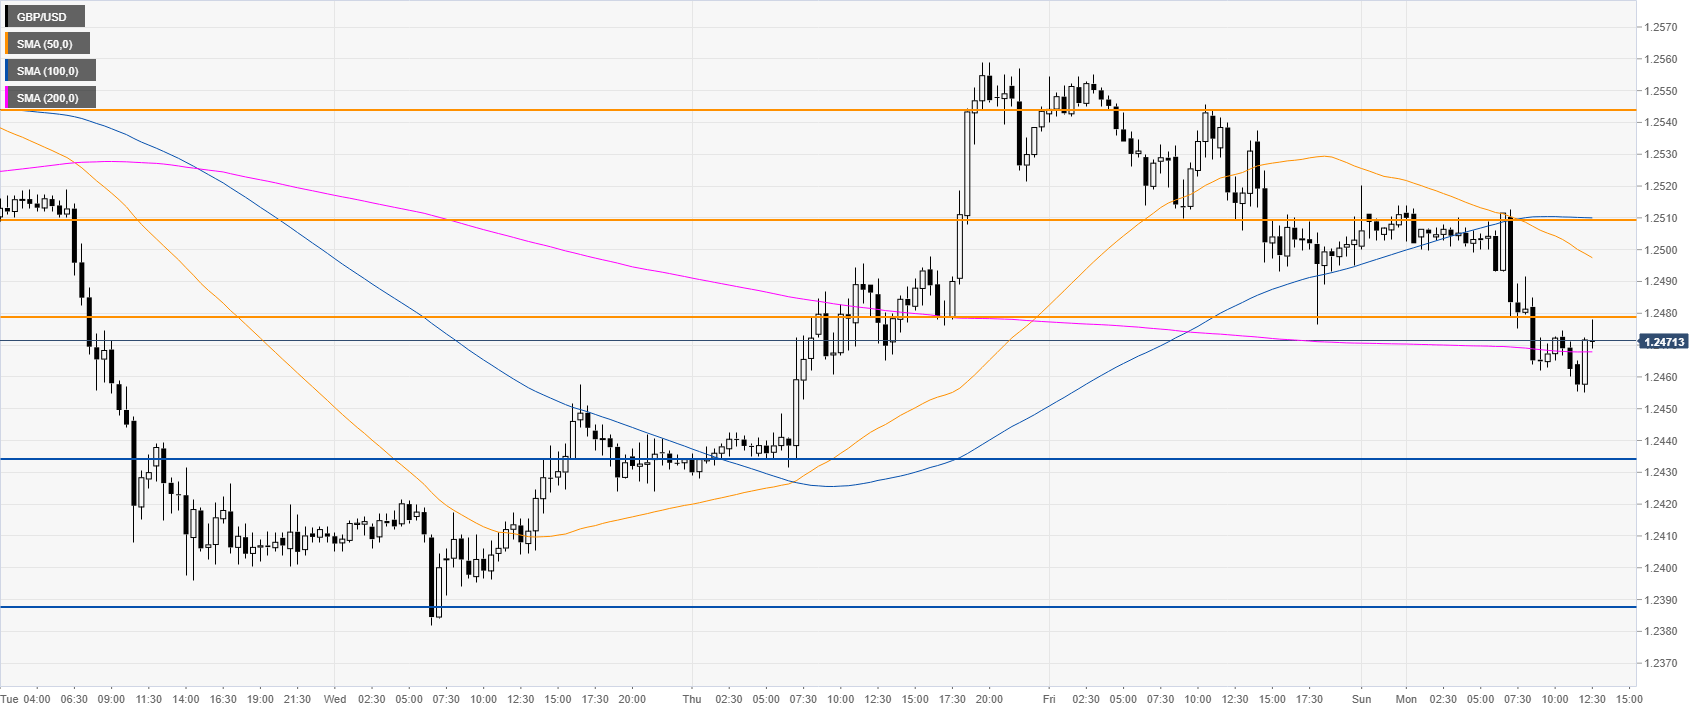
GBP/USD is off the daily lows challenging the 200 SMA. The 50 SMA crossed below the 100 SMA wich can be considered bearish. Immediate resistances are seen at 1.2478 and 1.2543. 
Additional key levels

GBP/USD

Overview
Today last price1.2475
Today Daily Change-0.0028
Today Daily Change %-0.22
Today daily open1.2503
 
Trends
Daily SMA201.2569
Daily SMA501.2646
Daily SMA1001.2868
Daily SMA2001.2875
Levels
Previous Daily High1.2557
Previous Daily Low1.2476
Previous Weekly High1.2579
Previous Weekly Low1.2382
Previous Monthly High1.2784
Previous Monthly Low1.2506
Daily Fibonacci 38.2%1.2507
Daily Fibonacci 61.8%1.2526
Daily Pivot Point S11.2467
Daily Pivot Point S21.2431
Daily Pivot Point S31.2387
Daily Pivot Point R11.2548
Daily Pivot Point R21.2593
Daily Pivot Point R31.2629

Author

Flavio Tosti

Flavio Tosti

Independent Analyst


More from Flavio Tosti

Share:

Editor's Picks

GBP/USD sticks to red near 1.3650, eyes on Iran sanctions

GBP/USD trades with a negative bias around mid-1.3600s at the start of a new week on Monday. The US Dollar recovers ground due to uncertainty over potential US economic sanctions on Iran, leaving the risk-sensitive British Pound on the backfoot.

EUR/USD stays defensive below 1.1700 amid cautious markets

EUR/USD is trading defensively below 1.1700 in Monday's European trading. The pair struggles as the US Dollar attempts a tepid recovery following last week's US Treasury bond buyback plan-led sell-off. Markets remain unnerved amid US threats to impose economic sanctions on Iran, the details of which are expected to be announced later in the day.

Gold sits at three-month highs near $4,650

Gold is sitting close to its highest level in three months, near $4,650, in the European session on Monday. The precious metal capitalizes on persistent US Dollar weakness, following the US Treasury's buyback plan amid fresh US-Canada trade tensions. Traders await Iran sanction details for further impetus.

Here's what I learned trading meme coins
I’ve been trading cryptocurrencies for the past seven years, with meme coins becoming one of the most exciting and implacable parts of my experience. I love them because they represent internet culture and community sentiment, and, let’s be honest, extreme speculation. Newly launched meme coins were especially tempting: get in early enough, I thought, and a small bet could turn into a huge return.
The week ahead: Jackson Hole and Nvidia results to take focus away from Trump
We start the week with the focus squarely on the US. Rising Treasury yields, the Jackson Hole Symposium, inflation and GDP data, along with tariff risks, will dominate market action in the coming days.
$20 billion offered, $2 billion taken: Why Treasury doubled its buyback cap

The US Treasury moved off its own calendar on Wednesday, and that is the part worth sitting with. At 12:32 GMT, the department said it would at least double the size of liquidity support buyback operations in the 10-year to 20-year and 20-year to 30-year sectors, lifting the maximum from $2 billion per operation to at least $4 billion, effective September 9 and running to November 4.