|

GBP/USD Technical Analysis: Cable is about to end the day in the red near the 1.2950 level
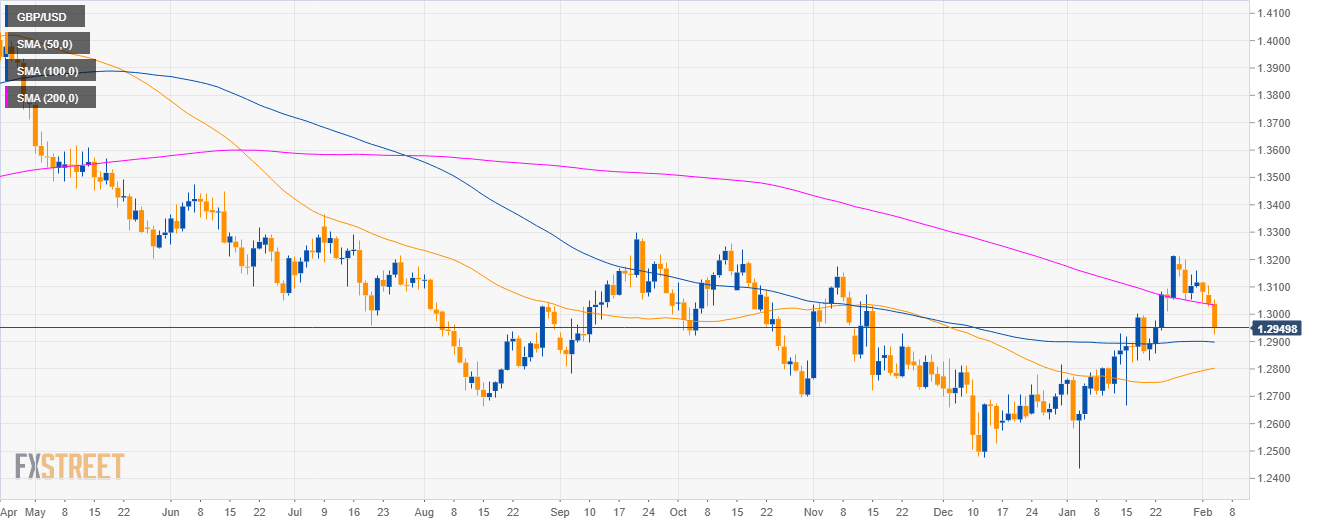
GBP/USD daily chart

  • Cable is falling below the 200-day simple moving average (SMA) as bears broke below the 1.3000 figure.

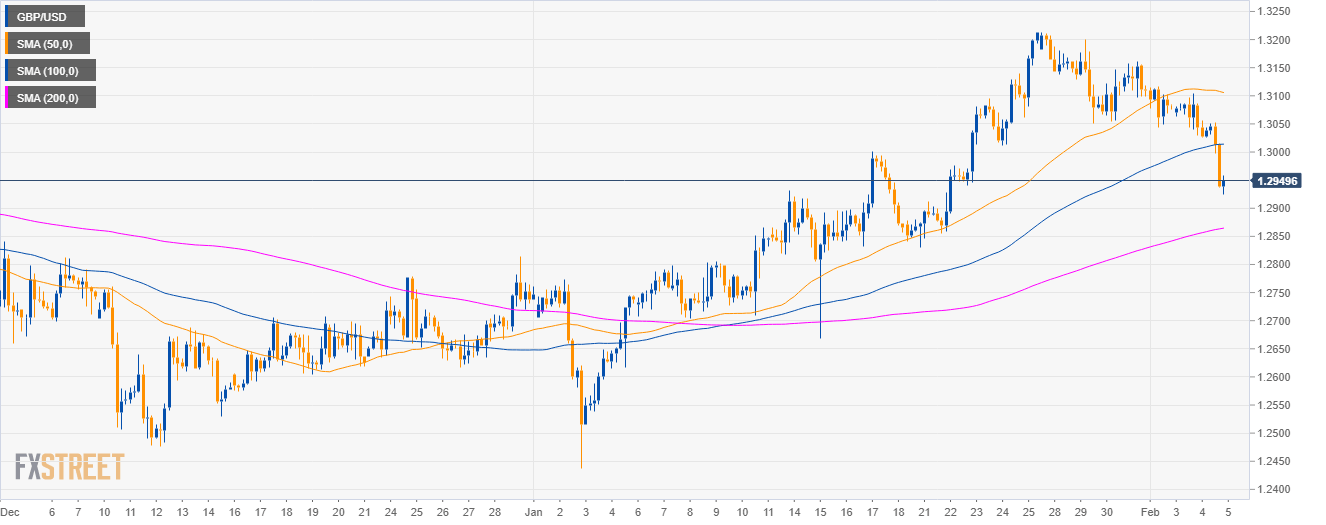
GBP/USD 4-hour chart

  • GBP/USD is trading below the 50 and 100 SMA suggesting bearish momentum in the medium-term.

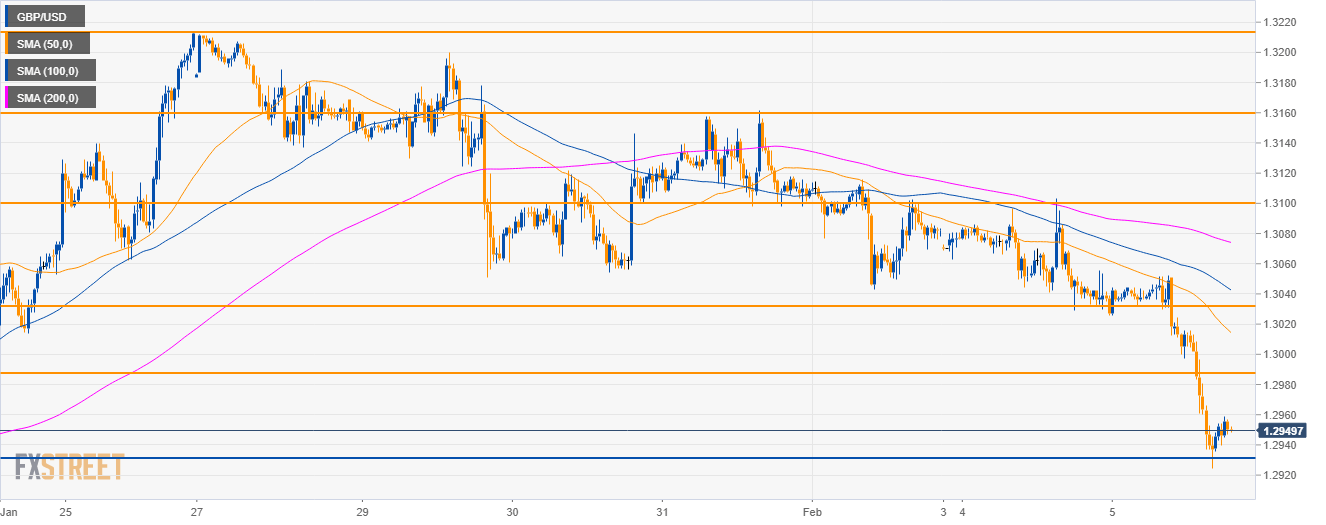
GBP/USD 30-minute chart

  • As discussed, the 1.2930 acted as support. This is now the level to beat for bears for further downside to 1.2900 the figure.
  • To the upside, bulls will set their eyes on 1.2990 and 1.3025 resistances.

Additional key levels

GBP/USD

Overview:
    Today Last Price: 1.295
    Today Daily change: -88 pips
    Today Daily change %: -0.67%
    Today Daily Open: 1.3038
Trends:
    Daily SMA20: 1.2968
    Daily SMA50: 1.2798
    Daily SMA100: 1.2899
    Daily SMA200: 1.3038
Levels:
    Previous Daily High: 1.3103
    Previous Daily Low: 1.3029
    Previous Weekly High: 1.3212
    Previous Weekly Low: 1.3043
    Previous Monthly High: 1.3214
    Previous Monthly Low: 1.2438
    Daily Fibonacci 38.2%: 1.3057
    Daily Fibonacci 61.8%: 1.3075
    Daily Pivot Point S1: 1.301
    Daily Pivot Point S2: 1.2982
    Daily Pivot Point S3: 1.2936
    Daily Pivot Point R1: 1.3085
    Daily Pivot Point R2: 1.3132
    Daily Pivot Point R3: 1.316

Author

Flavio Tosti

Flavio Tosti

Independent Analyst


More from Flavio Tosti
Share:

Editor's Picks

EUR/USD tumbles below 1.1800 as Middle East turmoil drives US Dollar demand

The EUR/USD pair falls to near 1.1770 during the early Asian session on Monday, pressured by a renewed US Dollar demand. The Greenback gathers strength against the Euro as the conflict across the Middle East is heightening traders' anxiety, boosting the safe-haven currencies. 

GBP/USD declines below 1.3450 on Middle East tensions, UK political uncertainty

The GBP/USD pair attracts some sellers to around 1.3420 during the early Asian session on Monday. The US Dollar edges higher against the Cable amid escalating tensions in the Middle East after recent US-Israeli strikes on Iran over the weekend.

Gold jumps over 2% toward $5,400 after US, Israel attack Iran

Gold is on fire at the start of the week, a widely expected move, as investors seek harbor in the traditional store of value, following the continued US and Israel attacks on Iran. The bright metal opened with a bullish gap of about $17 and rallied toward the $5,400 level as Asian traders hit their desks and reacted negatively to the weekend news of the Middle East conflict, rushing for cover in Gold.

Iran escalation: Quick thoughts on markets

Markets are likely to open the week with risk-off, with declines led by airlines, cyclicals and trade-exposed names, while energy, defense and “strategic” sectors may be relatively steadier.

Crisis in the Middle East: The market reaction

A primer on how markets will open on Monday, and why geopolitical risk may not be easily absorbed by financial markets this time around. Geopolitics and events between Iran, the US and the wider Middle East will dominate financial markets on Monday. The situation has continued to escalate as we move through Sunday. 

Starknet unveils strkBTC, shielded Bitcoin transactions on Ethereum Layer 2

Starknet, the Ethereum Layer 2 network developed by StarkWare, today announced strkBTC, a wrapped Bitcoin asset that introduces optional shielding while preserving full DeFi composability.