|

GBP/USD technical analysis: Cable erases Thursday’s spike, trading sub-1.2500 handle

  • The Sterling is dropping sharply in the New York session. 
  • The level to beat for sellers is the 1.2460 support level.
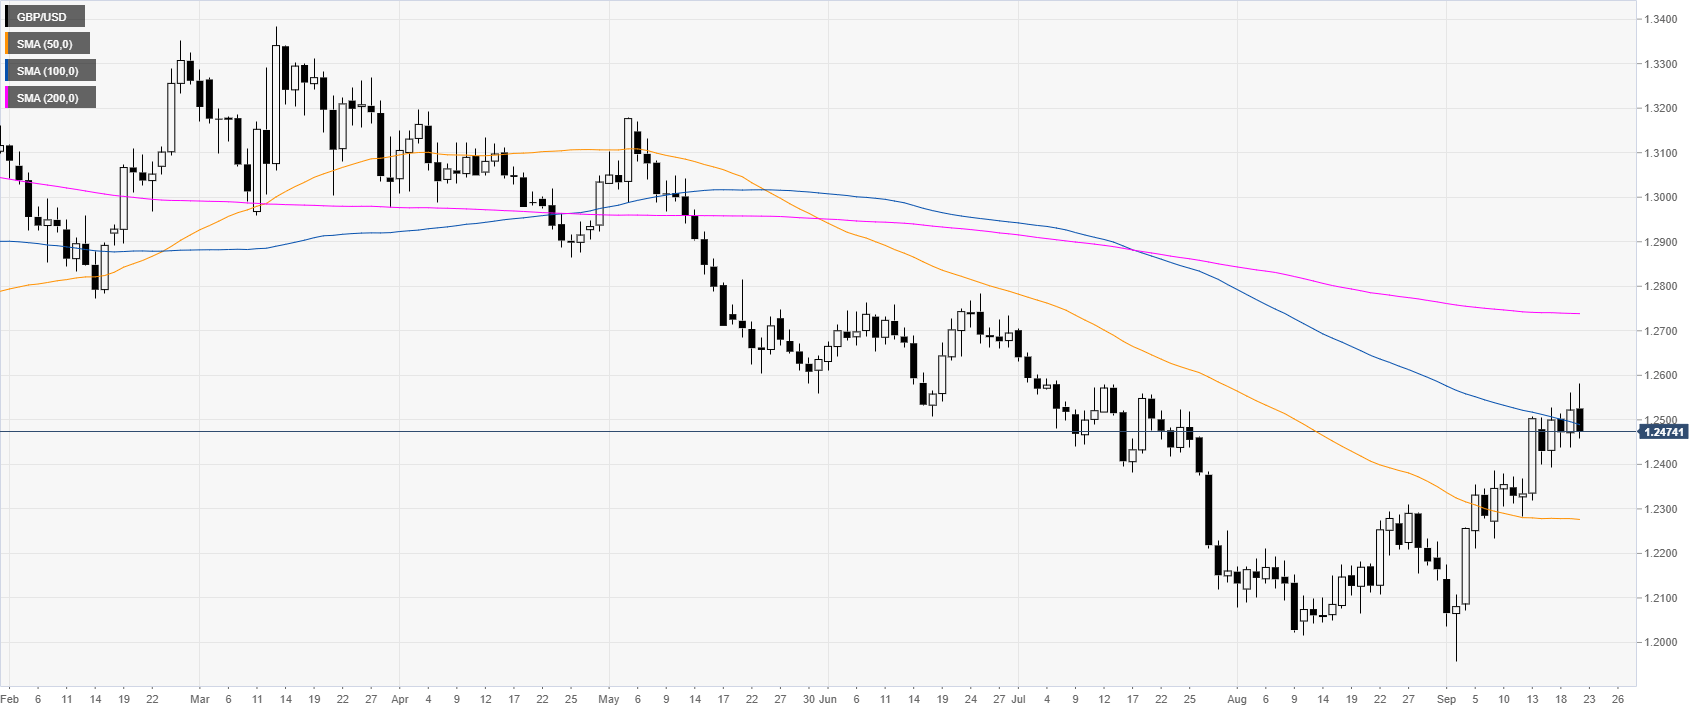
 

GBP/USD daily chart

 
The Sterling is trading in a bear trend below the 100 and 200-day simple moving averages (SMAs). However, GBP/USD has been on the rise in Septembre. It has been battling with the 1.2500 handle in the last week. 

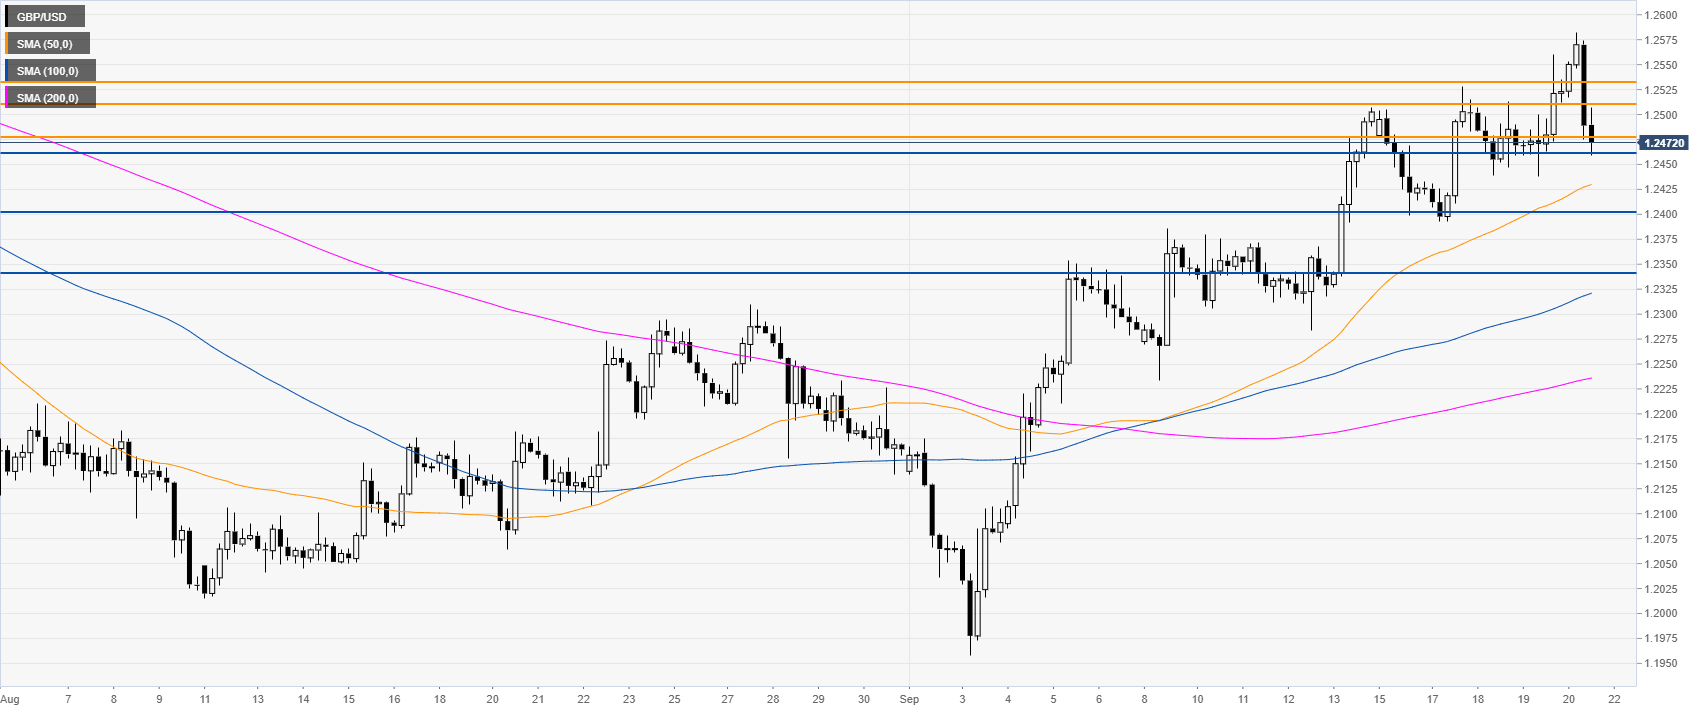
GBP/USD four-hour chart

 
GBP/USD is trading above the main SMAs, suggesting bullish momentum in the medium term. The market is challenging the 1.2460 support as bears took the helm this Friday. If the market loses the 1.2460 level, GBP/USD can correct down towards 1.2405 and 1.2340 price levels, according to the Technical Confluences Indicator

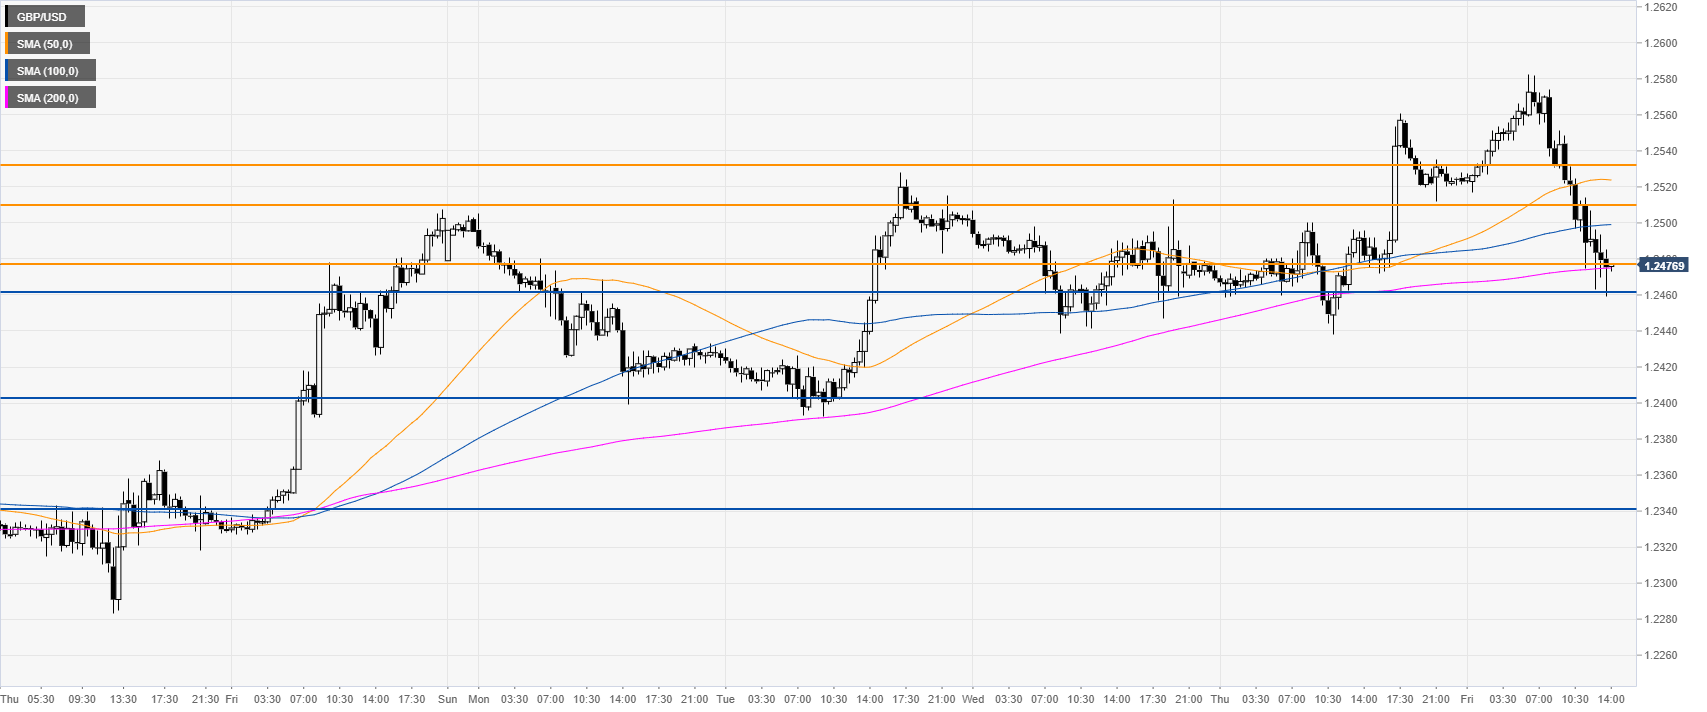
GBP/USD 30-minute chart


The Sterling is challenging the 200 SMA. Immediate resistance is the 1.2478 level followed by 1.2510 and the 1.2535 price level, according to the Technical Confluences Indicator. 

Additional key levels

GBP/USD

Overview
Today last price1.2476
Today Daily Change-0.0046
Today Daily Change %-0.37
Today daily open1.2522
 
Trends
Daily SMA201.2308
Daily SMA501.2278
Daily SMA1001.2496
Daily SMA2001.2739
 
Levels
Previous Daily High1.2561
Previous Daily Low1.2438
Previous Weekly High1.2508
Previous Weekly Low1.2234
Previous Monthly High1.231
Previous Monthly Low1.2015
Daily Fibonacci 38.2%1.2514
Daily Fibonacci 61.8%1.2485
Daily Pivot Point S11.2453
Daily Pivot Point S21.2384
Daily Pivot Point S31.2331
Daily Pivot Point R11.2576
Daily Pivot Point R21.2629
Daily Pivot Point R31.2698

Author

Flavio Tosti

Flavio Tosti

Independent Analyst


More from Flavio Tosti
Share:

Editor's Picks

EUR/USD flirts with daily highs, retargets 1.1900

EUR/USD regains upside traction, returning to the 1.1880 zone and refocusing its attention to the key 1.1900 barrier. The pair’s slight gains comes against the backdrop of a humble decline in the US Dollar as investors continue to assess the latest US CPI readings and the potential Fed’s rate path.

GBP/USD remains well bid around 1.3650

GBP/USD maintains its upside momentum in place, hovering around daily highs near 1.3650 and setting aside part of the recent three-day drop. Cable’s improved sentiment comes on the back of the Greenback’s  irresolute price action, while recent hawkish comments from the BoE’s Pill also collaborate with the uptick.

Gold clings to gains just above $5,000/oz

Gold is reclaiming part of the ground lost on Wednesday’s marked decline, as bargain-hunters keep piling up and lifting prices past the key $5,000 per troy ounce. The precious metal’s move higher is also underpinned by the slight pullback in the US Dollar and declining US Treasury yields across the curve.

Crypto Today: Bitcoin, Ethereum, XRP in choppy price action, weighed down by falling institutional interest 

Bitcoin's upside remains largely constrained amid weak technicals and declining institutional interest. Ethereum trades sideways above $1,900 support with the upside capped below $2,000 amid ETF outflows.

Week ahead – Data blitz, Fed Minutes and RBNZ decision in the spotlight

US GDP and PCE inflation are main highlights, plus the Fed minutes. UK and Japan have busy calendars too with focus on CPI. Flash PMIs for February will also be doing the rounds. RBNZ meets, is unlikely to follow RBA’s hawkish path.

Ripple Price Forecast: XRP potential bottom could be in sight

Ripple edges up above the intraday low of $1.35 at the time of writing on Friday amid mixed price actions across the crypto market. The remittance token failed to hold support at $1.40 the previous day, reflecting risk-off sentiment amid a decline in retail and institutional sentiment.