|

GBP/USD Technical Analysis: Bulls in the driver’s seat, eyeing the 1.3000 handle

  • The cable is trading near weekly highs as the American session is coming to an end.
  • The level to beat for bulls is the 1.2910 level.
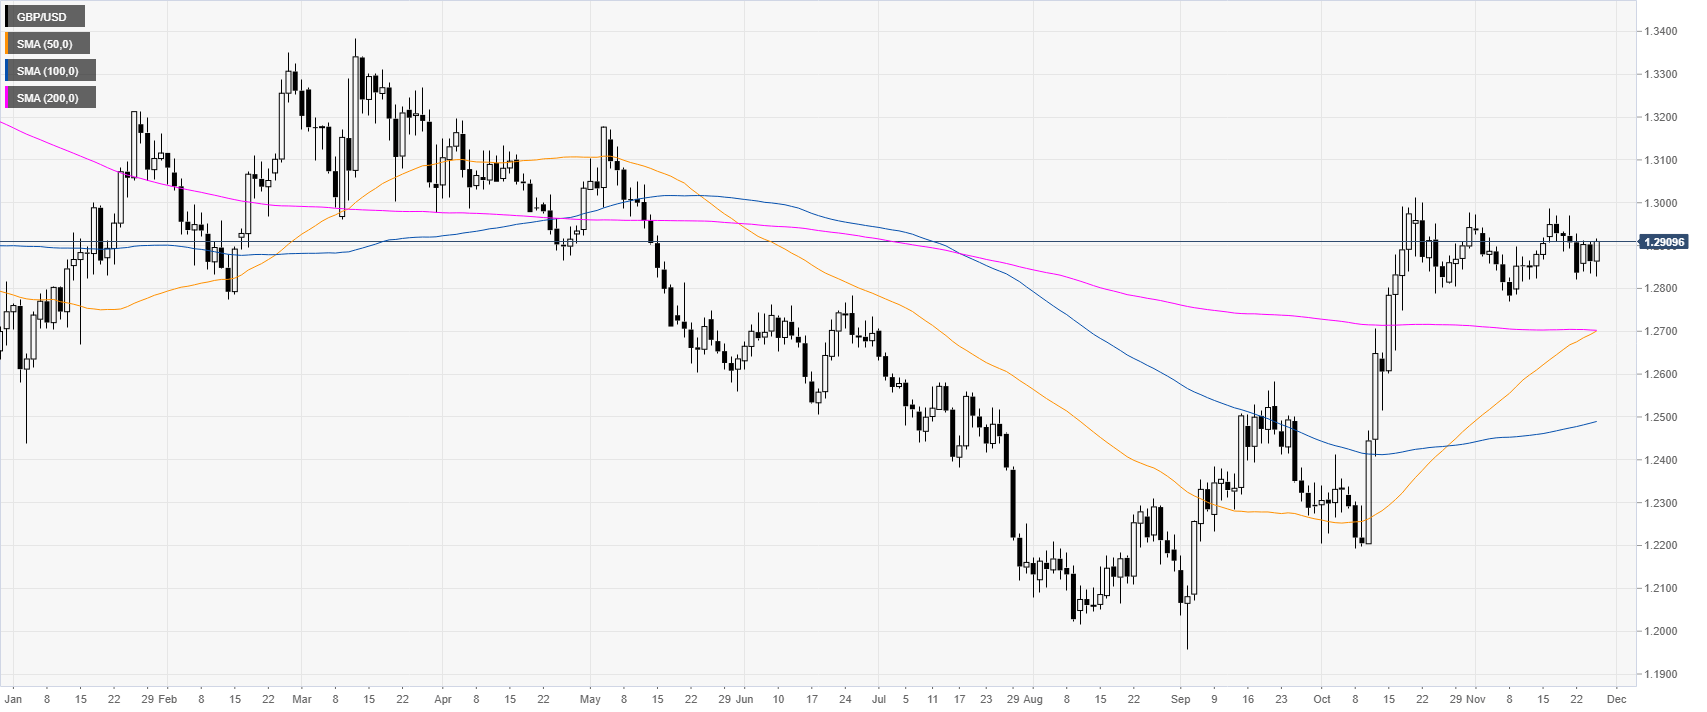
GBP/USD daily chart


GBP/USD is trading just above the 1.2900 handle as the market is consolidating the huge October’s bull run. The market keeps a bullish bias while trading above the main daily simple moving averages (DMAs).
 

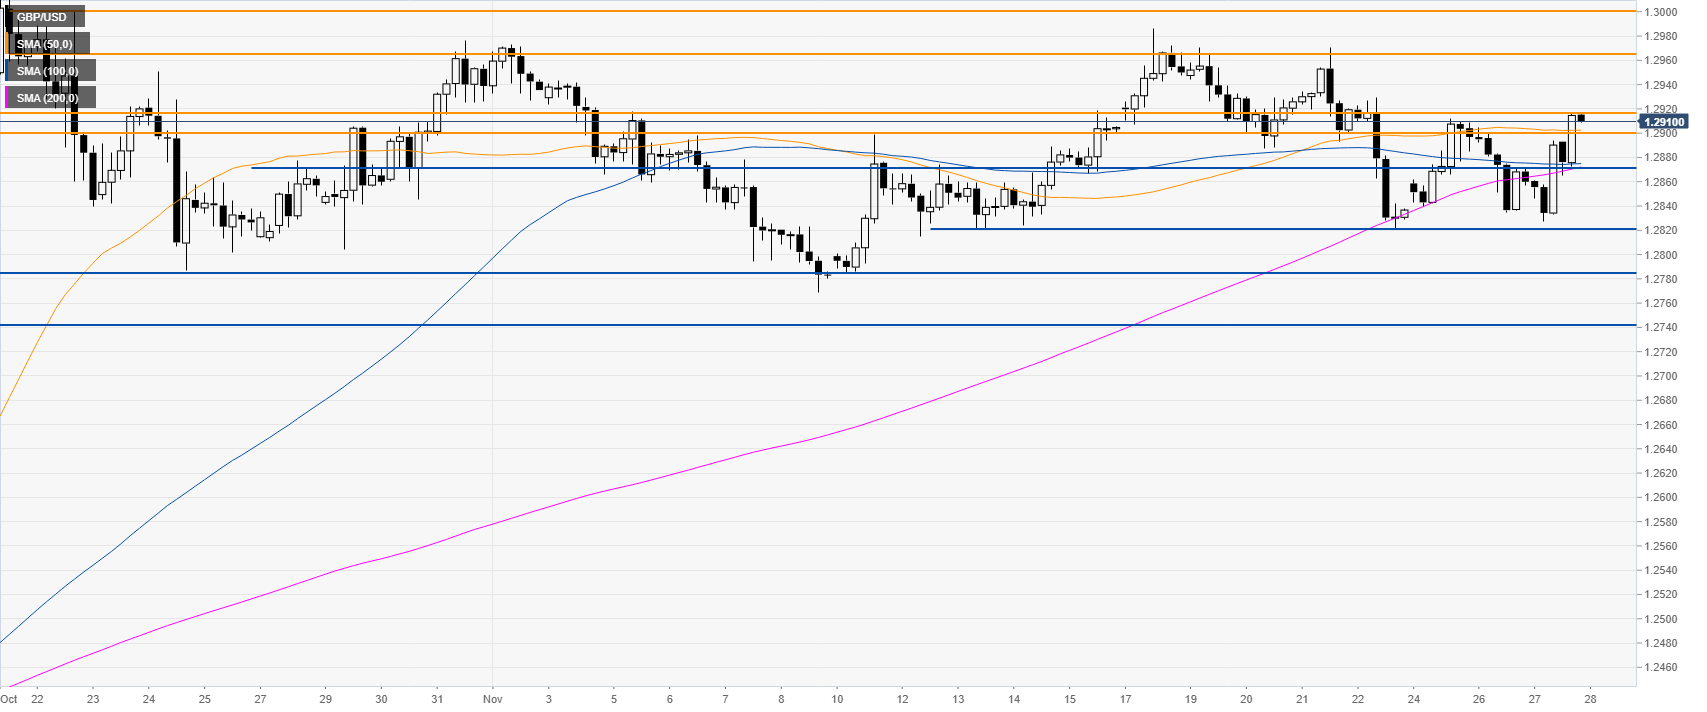
GBP/USD four-hour chart

 
The market is challenging a critical resistance in the 1.2900/1.2910 price zone. A breach beyond it could lead to further gains, which can extend towards the 1.2965/1.3000 resistance zone. 


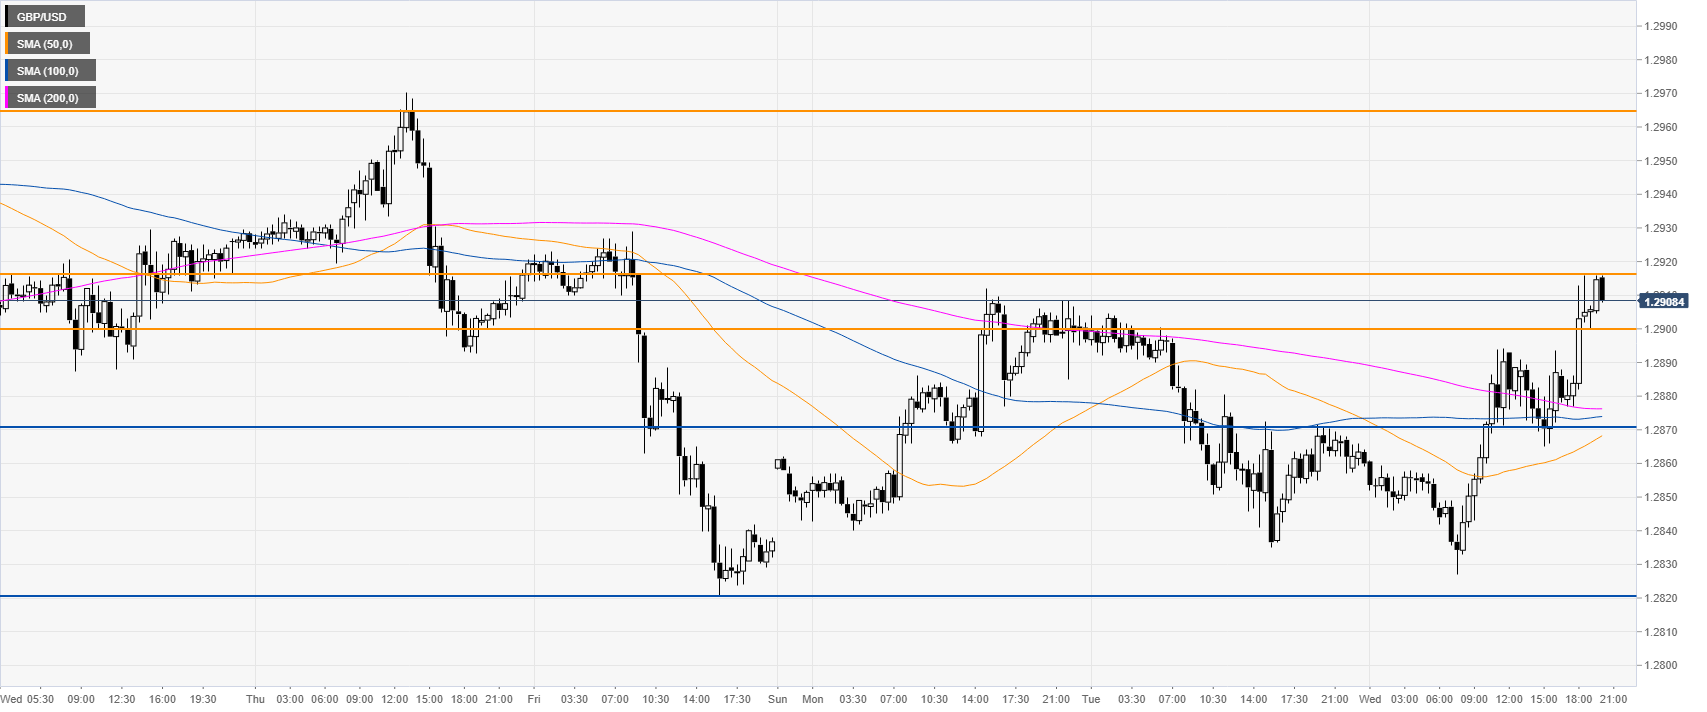
GBP/USD 30-minute chart

 
Sterling is trading above the main SMAs, suggesting a bullish bias in the short term. Support is expected near the 1.2900 and 1.2870 levels, according to the Technical Confluences Indicator
 

Additional key levels

GBP/USD

Overview
Today last price1.2912
Today Daily Change0.0048
Today Daily Change %0.37
Today daily open1.2864
 
Trends
Daily SMA201.2882
Daily SMA501.2692
Daily SMA1001.2485
Daily SMA2001.2703
 
Levels
Previous Daily High1.2908
Previous Daily Low1.2835
Previous Weekly High1.2986
Previous Weekly Low1.2821
Previous Monthly High1.3013
Previous Monthly Low1.2194
Daily Fibonacci 38.2%1.2863
Daily Fibonacci 61.8%1.288
Daily Pivot Point S11.283
Daily Pivot Point S21.2795
Daily Pivot Point S31.2756
Daily Pivot Point R11.2903
Daily Pivot Point R21.2943
Daily Pivot Point R31.2977

Author

Flavio Tosti

Flavio Tosti

Independent Analyst


More from Flavio Tosti
Share:

Editor's Picks

EUR/USD risks a deeper drop below 1.1750

EUR/USD keeps its vacillating mood in place as the the NA session drwas to a close on Tuesday, hovering below the 1.1800 hurdle amid acceptable gains in the US Dollar. In the meantime, market participants and the FX galaxy are expected to closely follow President Trump’s SOTU speech around 2AM GMT.
 

GBP/USD regains 1.3500 and above

GBP/USD extends its advance for the third day in a row on Tuesday, this time retesting the area beyond the 1.3500 hurdle. Cable’s uptick comes despite decent gains in the Greenback and the dovish message from the BoE’s Bailey at the UK Parliament.

Gold appears offered around $5,150

Gold is giving back a good portion of the recent multi-day rally, receding to the $5,150 zone per troy ounce amid the decent bounce in the US Dollar and mixed US Treasuty yields. In the meantime, markets’ attention remain on upcoming comments from Fed speakers.

Ripple’s DeFi shift in focus: Navigating XRPL EVM sidechain growth, XRPFi migration and liquidity
Ripple (XRP) has continued to trade under pressure, extending its decline by approximately 63% from the record high of $3.66 in July. The remittance token is trading above support at $1.35, while its upside appears limited by key supply zones, starting with $1.40, at the time of writing on Tuesday.
The Citrini report: How a debatable AI narrative can shake Wall Street

That AI-related headline alone was enough to rattle investors.US stocks slid sharply on Monday after a widely circulated Citrini Research memo outlined a hypothetical “2028 Global Intelligence Crisis”, warning that rapid AI adoption could push US unemployment into double digits as early as by mid-2028.

XRP pressured by weak ETF flows and declining retail interest

Ripple (XRP) is edging lower, trading above its intraday low of $1.32 at the time of writing on Tuesday. The decline from its weekly opening of $1.39 reflects heightened volatility in the broader cryptocurrency market, accentuated by tariff-triggered uncertainty.