|

GBP/USD technical analysis: Bullish flag pattern spotted on short-term charts

  • The pair failed to build on the overnight bounce from the 1.2800 neighbourhood.
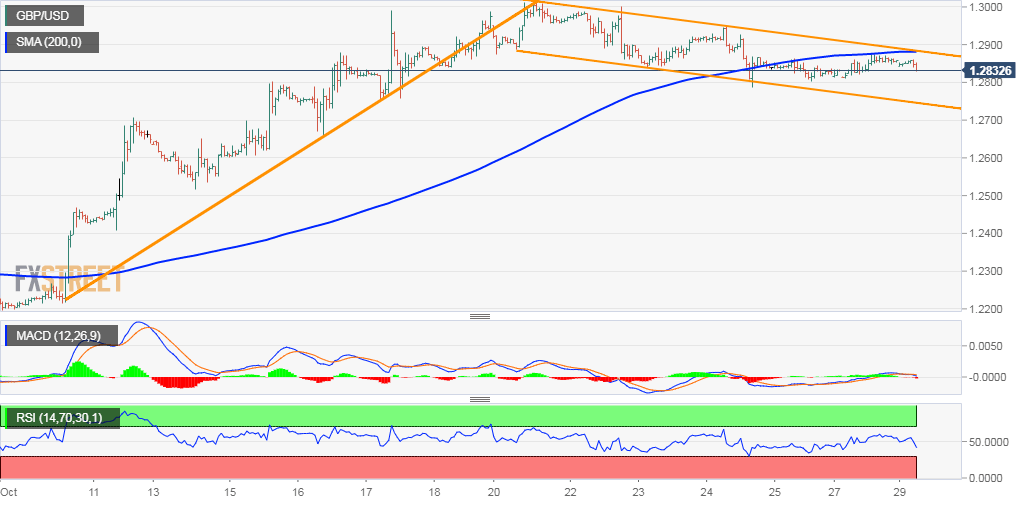
  • Sustained move beyond 200-hour SMA needed for a fresh bullish confirmation.

The GBP/USD pair showed some resilience near the 1.2800 handle and staged a goodish intraday bounce on the first day of a new trading week, albeit lacked any strong follow-through. The pair was seen consolidating in a range through the early European session on Tuesday as investors seemed reluctant ahead of yet another UK parliamentary vote on an early election.
 
Meanwhile, the recent pullback from multi-month tops had been along a descending trend-channel on hourly charts. Given the recent strong move up from the 1.2200 neighbourhood, tested earlier this month, the mentioned channel seemed to constitute towards the formation of a bullish continuation flag chart pattern and support prospects for a further near-term positive move.
 
However, bulls are likely to wait for a sustained breakthrough the trend-channel resistance, currently near the 1.2870 region, and a subsequent strength beyond 200-hour SMA before positioning for momentum towards the 1.2970-75 intermediate resistance en-route the key 1.30 psychological mark.
 
On the flip side, any meaningful pullback might continue to find some support near the 1.2800 handle, below which bears are likely to aim towards challenging the trend-channel support, currently near the 1.2750-45 region. Failure to defend the trend-channel support will negate the constructive set-up and pave the way for an extension of the recent corrective slide.

GBP/USD 1-hourly chart

fxsoriginal

GBP/USD

Overview
Today last price1.2843
Today Daily Change-0.0017
Today Daily Change %-0.13
Today daily open1.286
 
Trends
Daily SMA201.2622
Daily SMA501.2436
Daily SMA1001.2433
Daily SMA2001.2715
 
Levels
Previous Daily High1.2878
Previous Daily Low1.2811
Previous Weekly High1.3013
Previous Weekly Low1.2787
Previous Monthly High1.2583
Previous Monthly Low1.1958
Daily Fibonacci 38.2%1.2852
Daily Fibonacci 61.8%1.2836
Daily Pivot Point S11.2822
Daily Pivot Point S21.2783
Daily Pivot Point S31.2755
Daily Pivot Point R11.2888
Daily Pivot Point R21.2916
Daily Pivot Point R31.2955

Author

Haresh Menghani

Haresh Menghani is a detail-oriented professional with 10+ years of extensive experience in analysing the global financial markets.

More from Haresh Menghani
Share:

Editor's Picks

EUR/USD off highs, back to 1.1850

EUR/USD loses some upside momentum, returning to the 1.1850 region amid humble losses. The pair’s slight decline comes against the backdrop of a marginal advance in the US Dollar as investors continue to assess the latest US CPI readings.

GBP/USD advances to daily tops around 1.3650

GBP/USD now manages to pick up extra pace, clinching daily highs around 1.3650 and leaving behind three consecutive daily pullbacks on Friday. Cable’s improved sentiment comes on the back of the inconclusive price action of the Greenback, while recent hawkish comments from the BoE’s Pill also collaborates with the uptick.

Gold surpasses $5,000/oz, daily highs

Gold is reclaiming part of the ground lost on Wednesday’s marked decline, as bargain-hunters keep piling up and lifting prices past the key $5,000 per troy ounce. The yellow metal’s upside is also propped up by the lack of clear direction around the US Dollar post-US CPI release.

Crypto Today: Bitcoin, Ethereum, XRP in choppy price action, weighed down by falling institutional interest 

Bitcoin's upside remains largely constrained amid weak technicals and declining institutional interest. Ethereum trades sideways above $1,900 support with the upside capped below $2,000 amid ETF outflows.

Week ahead – Data blitz, Fed Minutes and RBNZ decision in the spotlight

US GDP and PCE inflation are main highlights, plus the Fed minutes. UK and Japan have busy calendars too with focus on CPI. Flash PMIs for February will also be doing the rounds. RBNZ meets, is unlikely to follow RBA’s hawkish path.

Ripple Price Forecast: XRP potential bottom could be in sight

Ripple edges up above the intraday low of $1.35 at the time of writing on Friday amid mixed price actions across the crypto market. The remittance token failed to hold support at $1.40 the previous day, reflecting risk-off sentiment amid a decline in retail and institutional sentiment.