GBP/USD Technical Analysis: 21-day EMA, June month high restrict immediate declines
- GBP/USD sellers catch a breath around the monthly low.
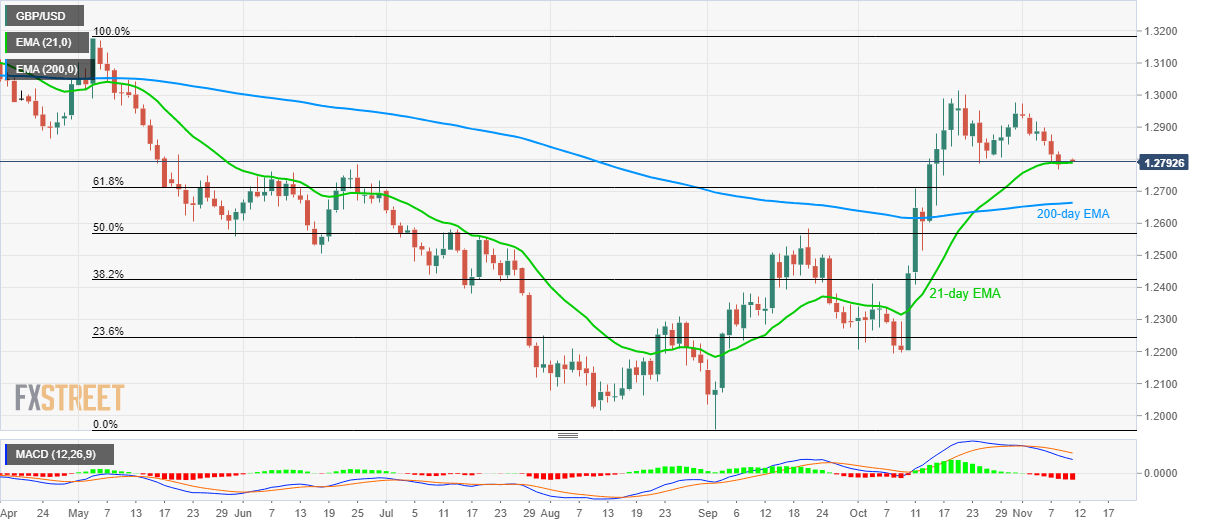
- Bearish MACD signal further declines.
- 61.8% Fibonacci retracement, 200-day EMA become the key during further downside.

Despite declining to the lowest since October 17 on Friday, GBP/USD stops additional south-run around short-term key supports while trading near 1.2793 amid the initial Asian session on Monday.
Read for recent fundaments: Moody’s: UK outlook cut to negative on policy 'paralysis – Cable slips below 1.2800
An area comprising 21-day Exponential Moving Average (EMA) and June month high around 1.2790/85 becomes important for pair sellers while targeting 61.8% Fibonacci retracement of May-September downside, at 1.2710.
While bearish signals from 12-bar Moving Average Convergence and Divergence (MACD) indicate further weakness of the quote, a 200-day EMA level of 1.2664 could challenge sellers past-1.2710.
On the upside, 1.2860 and monthly high close to 1.2980 can entertain short-term buyers ahead of challenging them with 1.3000 round-figure and October top of 1.3013.
Though, May month high near 1.3180 will be on bull’s radar during pair’s sustained rise beyond 1.3013.
GBP/USD daily chart
Trend: pullback expected
Author

Anil Panchal
FXStreet
Anil Panchal has nearly 15 years of experience in tracking financial markets. With a keen interest in macroeconomics, Anil aptly tracks global news/updates and stays well-informed about the global financial moves and their implications.


