GBP/USD technical analysis: 200-hour SMA, overbought RSI doubt recent recovery
- EU election results propel prices on the UK holiday.
- Overbought RSI and near-term resistance-line can question upside.
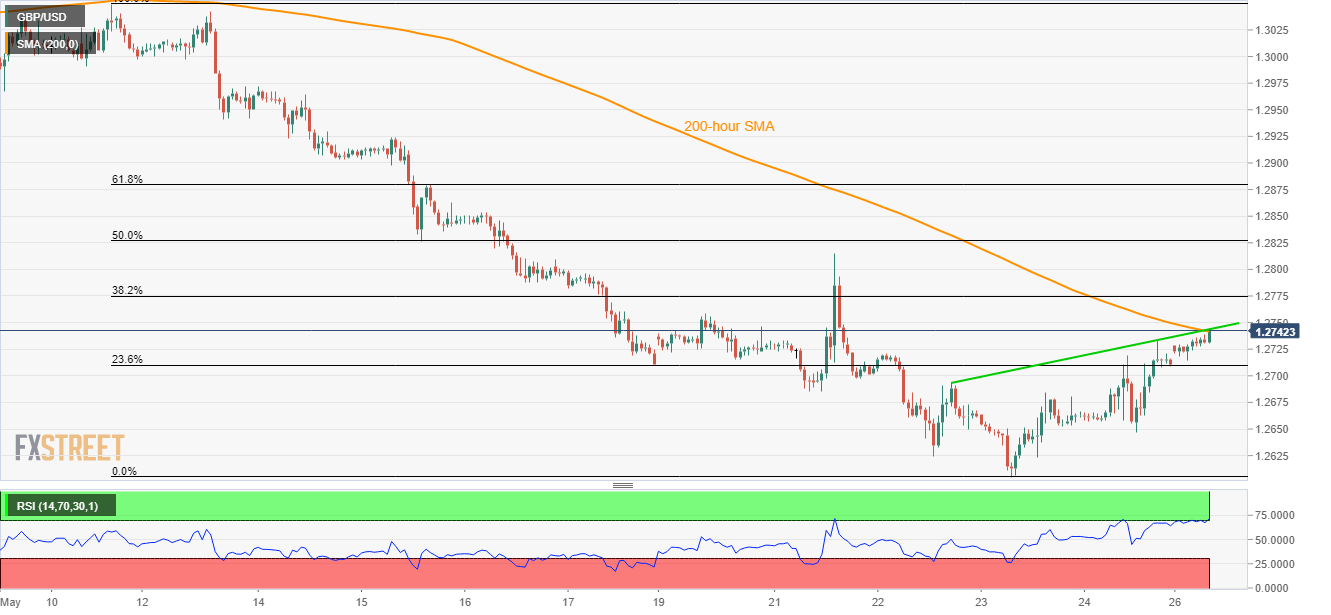
In spite of trading at the highest levels in a week, GBP/USD upside is being challenged by overbought RSI and 200-hour SMA around 1.2745/50 while heading into the European open on Monday.
As a result, chances of the quote’s pullback to 1.2730 and then to 1.2710 including 23.6% Fibonacci retracement of pair’s declines past-May 10 can’t be ruled out.
During the pair’s addition declines under 1.2710, 1.2650, 1.2625 and 1.2600 might become bears’ favorites.
On the contrary, ignorance of 200-hour simple moving average (SMA) and overbought levels of the relative strength index (RSI) can escalate the pair’s rise to 1.2760 and last week’s high near 1.2815.
Further, pair’s sustained rise beyond 1.2815 can push buyers to target 50% Fibonacci retracement level of 1.2830 ahead of making them confront 61.8% Fibonacci retracement of 1.2880 and 1.2905 resistances.
GBP/USD hourly chart
Trend: Pullback expected
Author

Anil Panchal
FXStreet
Anil Panchal has nearly 15 years of experience in tracking financial markets. With a keen interest in macroeconomics, Anil aptly tracks global news/updates and stays well-informed about the global financial moves and their implications.


