GBP/USD technical analysis: 1.2705/15 becomes the tough nut to crack for buyers


  • GBP/USD steps back from the key resistance-confluence.
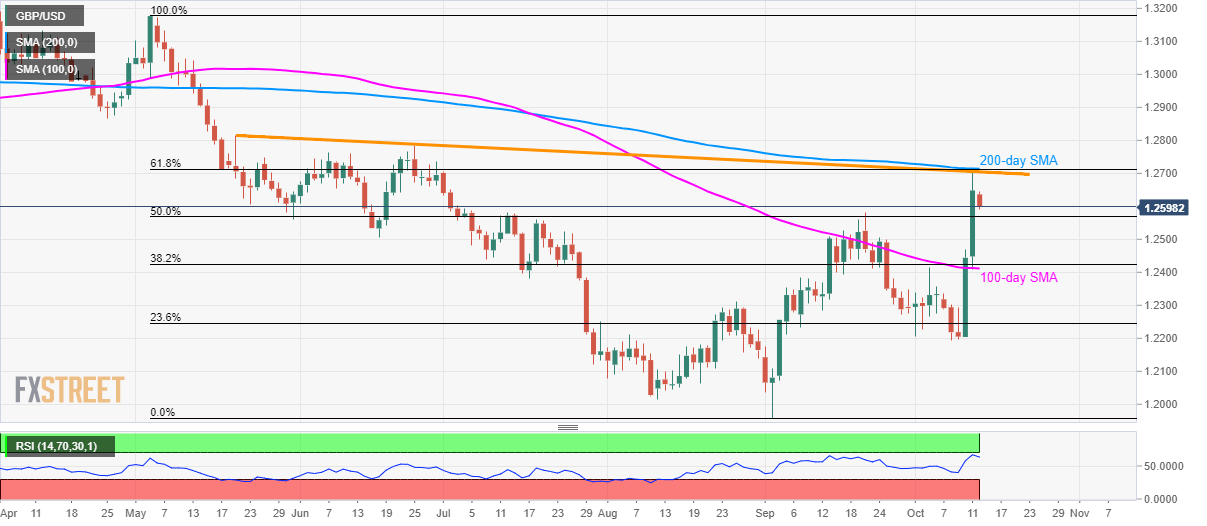
  • 50% Fibonacci retracement can entertain short-term sellers while 100-day SMA could question bears afterward.

Failure to cross the key resistance confluence presently drags the GBP/USD pair downwards to 1.2600 while heading into the London open on Monday.

The pair now aims for 50% Fibonacci retracement of May-September declines, at 1.2568, during further declines. However, 100-day Simple Moving Average (SMA), near 1.2410 now, can limit the pair’s additional south-run.

Also supporting the sellers is overbought conditions of 14-bar Relative Strength Index (RSI).

Should bears refrain from respecting 1.2410 rest-point, early-month low nearing 1.2195 will flash on their radar.

Alternatively, 61.8% Fibonacci retracement, 200-day SMA and a falling trend-line since May 21 limit the pair’s upside around 1.2705/15, a break of which could escalate the run-up to June month high surrounding 1.2785.

During the pair’s extended rise past-1.2785, 1.2815 and 1.2865 will becomes bulls’ favorites.

GBP/USD daily chart

Trend: pullback expected

additional important levels

Overview
Today last price 1.2606
Today Daily Change -42 pips
Today Daily Change % -0.33%
Today daily open 1.2648
 
Trends
Daily SMA20 1.2382
Daily SMA50 1.2272
Daily SMA100 1.2413
Daily SMA200 1.2715
 
Levels
Previous Daily High 1.2707
Previous Daily Low 1.2408
Previous Weekly High 1.2707
Previous Weekly Low 1.2194
Previous Monthly High 1.2583
Previous Monthly Low 1.1958
Daily Fibonacci 38.2% 1.2593
Daily Fibonacci 61.8% 1.2522
Daily Pivot Point S1 1.2468
Daily Pivot Point S2 1.2288
Daily Pivot Point S3 1.2168
Daily Pivot Point R1 1.2768
Daily Pivot Point R2 1.2887
Daily Pivot Point R3 1.3067


Share: Feed news

Information on these pages contains forward-looking statements that involve risks and uncertainties. Markets and instruments profiled on this page are for informational purposes only and should not in any way come across as a recommendation to buy or sell in these assets. You should do your own thorough research before making any investment decisions. FXStreet does not in any way guarantee that this information is free from mistakes, errors, or material misstatements. It also does not guarantee that this information is of a timely nature. Investing in Open Markets involves a great deal of risk, including the loss of all or a portion of your investment, as well as emotional distress. All risks, losses and costs associated with investing, including total loss of principal, are your responsibility. The views and opinions expressed in this article are those of the authors and do not necessarily reflect the official policy or position of FXStreet nor its advertisers. The author will not be held responsible for information that is found at the end of links posted on this page.

If not otherwise explicitly mentioned in the body of the article, at the time of writing, the author has no position in any stock mentioned in this article and no business relationship with any company mentioned. The author has not received compensation for writing this article, other than from FXStreet.

FXStreet and the author do not provide personalized recommendations. The author makes no representations as to the accuracy, completeness, or suitability of this information. FXStreet and the author will not be liable for any errors, omissions or any losses, injuries or damages arising from this information and its display or use. Errors and omissions excepted.

The author and FXStreet are not registered investment advisors and nothing in this article is intended to be investment advice.

Recommended content


Recommended content

Editors’ Picks

AUD/USD failed just ahead of the 200-day SMA

AUD/USD failed just ahead of the 200-day SMA

Finally, AUD/USD managed to break above the 0.6500 barrier on Wednesday, extending the weekly recovery, although its advance faltered just ahead of the 0.6530 region, where the key 200-day SMA sits.

AUD/USD News

EUR/USD met some decent resistance above 1.0700

EUR/USD met some decent resistance above 1.0700

EUR/USD remained unable to gather extra upside traction and surpass the 1.0700 hurdle in a convincing fashion on Wednesday, instead giving away part of the weekly gains against the backdrop of a decent bounce in the Dollar.

EUR/USD News

Gold keeps consolidating ahead of US first-tier figures

Gold keeps consolidating ahead of US first-tier figures

Gold finds it difficult to stage a rebound midweek following Monday's sharp decline but manages to hold above $2,300. The benchmark 10-year US Treasury bond yield stays in the green above 4.6% after US data, not allowing the pair to turn north.

Gold News

Bitcoin price could be primed for correction as bearish activity grows near $66K area

Bitcoin price could be primed for correction as bearish activity grows near $66K area

Bitcoin (BTC) price managed to maintain a northbound trajectory after the April 20 halving, despite bold assertions by analysts that the event would be a “sell the news” situation. However, after four days of strength, the tables could be turning as a dark cloud now hovers above BTC price.

Read more

Bank of Japan's predicament: The BOJ is trapped

Bank of Japan's predicament: The BOJ is trapped

In this special edition of TradeGATEHub Live Trading, we're joined by guest speaker Tavi @TaviCosta, who shares his insights on the Bank of Japan's current predicament, stating, 'The BOJ is Trapped.' 

Read more

Forex MAJORS

Cryptocurrencies

Signatures