GBP/USD steady near 1.3360 post soft UK CPI
- GBP/USD recovers as improved risk tone offsets post-data Sterling weakness.
- UK CPI remains unchanged at 3.8% YoY, undershooting 4% forecast and fueling dovish BoE expectations.
- Services inflation steadies at 4.7%, prompting markets to price in 19 bps of December cuts.

GBP/USD holds firm during the North American session on Wednesday following the latest inflation report in the United Kingdom, which triggered some weakness in the Pound Sterling (GBP), as expectations for further easing by the Bank of England (BoE) increased. The pair trades at 1.3362, virtually unchanged after diving to 1.3305 following the release of the CPI data.
Sterling trims losses post-CPI miss as traders eye upcoming Fed and US inflation data
The economic docket in the US remains subdued, with companies reporting earnings that indicate sustained investment in AI. Meanwhile, US President Donald Trump tempered his trade rhetoric on China, improving the risk appetite during the last couple of days.
The Office for National Statistics (ONS) revealed that inflation undershot in September, particularly the Consumer Price Index (CPI), which was unchanged from August at 3.8% YoY, below estimates for a 4% increase. Core CPI dipped by 3.5% YoY for the same month, down from 3.6% in the previous month and below forecasts for a 3.7% uptick.
In the meantime, Services inflation —stickier than goods and sought by the BoE —was steady at 4.7%, below forecasts of 4.9%. This triggered an adjustment in expectations for rate cuts by the BoE, following the data release. Market participants are pricing in 19 basis points of cuts for the December meeting, up from 11 basis points a day ago.
Next week, the Federal Reserve (Fed) is expected to cut rates by 25 basis points in the October 28-29 meeting, barring some unexpected surprises in the CPI report, which is scheduled to be released on Friday.
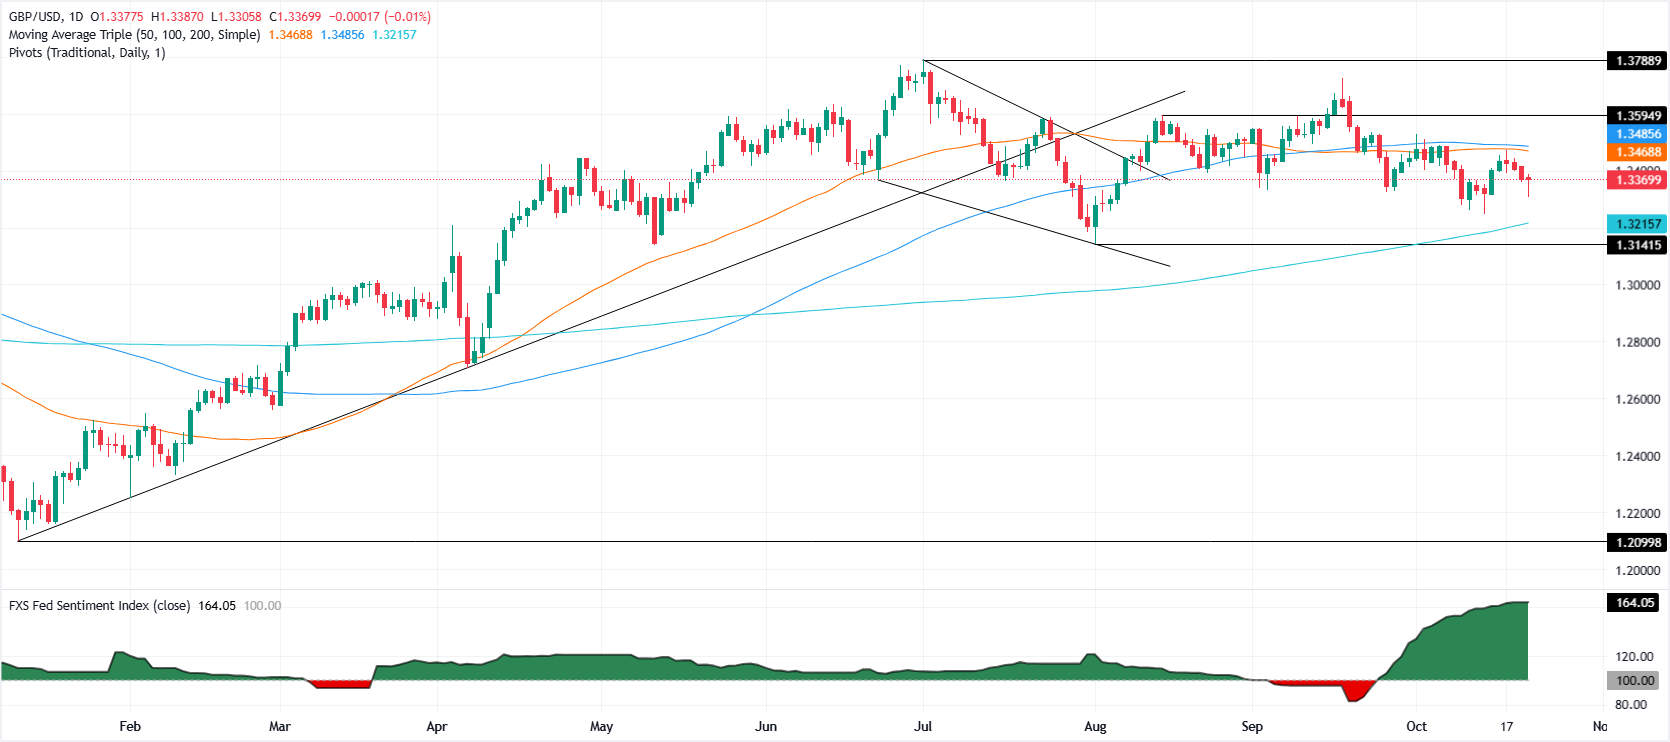
GBP/USD Price Forecast: To stay bearish below 1.34
The GBP/USD technical picture is neutral to downward-biased, though if the pair ends on a daily basis above the 20-day SMA at 1.3399, look for a test of the 50-day SMA at around 1.3465. A breach of the latter would expose the 100-day SMA at 1.3482 and the 1.3500 milestone.
On the flip side, if GBP/USD clears 1.3300, this opens the door for a fall towards the October 14 swing low of 1.3248, ahead of the 200-day SMA at 1.3212.
Sterling bulls have had little to justify a break above the 21-day moving average, which continues to cap GBP/USD’s descent from mid-September highs of 1.3726. The pair is now down ~2% from those levels, and recent data only reinforces the bearish momentum.
Pound Sterling Price This week
The table below shows the percentage change of British Pound (GBP) against listed major currencies this week. British Pound was the strongest against the Japanese Yen.
| USD | EUR | GBP | JPY | CAD | AUD | NZD | CHF | |
|---|---|---|---|---|---|---|---|---|
| USD | 0.45% | 0.47% | 0.82% | -0.25% | -0.17% | -0.27% | 0.46% | |
| EUR | -0.45% | 0.02% | 0.48% | -0.70% | -0.53% | -0.79% | 0.02% | |
| GBP | -0.47% | -0.02% | 0.20% | -0.72% | -0.55% | -0.81% | -0.01% | |
| JPY | -0.82% | -0.48% | -0.20% | -1.13% | -1.03% | -1.19% | -0.47% | |
| CAD | 0.25% | 0.70% | 0.72% | 1.13% | 0.12% | -0.09% | 0.71% | |
| AUD | 0.17% | 0.53% | 0.55% | 1.03% | -0.12% | -0.26% | 0.53% | |
| NZD | 0.27% | 0.79% | 0.81% | 1.19% | 0.09% | 0.26% | 0.80% | |
| CHF | -0.46% | -0.02% | 0.01% | 0.47% | -0.71% | -0.53% | -0.80% |
The heat map shows percentage changes of major currencies against each other. The base currency is picked from the left column, while the quote currency is picked from the top row. For example, if you pick the British Pound from the left column and move along the horizontal line to the US Dollar, the percentage change displayed in the box will represent GBP (base)/USD (quote).
Author

Christian Borjon Valencia
FXStreet
Markets analyst, news editor, and trading instructor with over 14 years of experience across FX, commodities, US equity indices, and global macro markets.


