GBP/USD stalls at around 1.2420 firm on solid USD, mixed sentiment
- GBP/USD swings in a 60-pip range, impacted by US bond yields and lack of domestic data.
- The World Bank ups 2023 US growth forecast to 1.1% but slashes projections for 2024 amidst the manufacturing slump.
- Central bank policy decisions are in the spotlight as RBA hikes rates; BoC takes center stage, Fed decision awaited.

GBP/USD hovers around the 1.2420s area after traveling around a 60-pip range on Tuesday, capped by the lack of economic data from the United States (US) and mixed market sentiment. Factors linked to US bond yields and the greenback, weighed on the Pound Sterling (GBP), set to register back-to-back days of losses. At the time of writing, the GBP/USD is trading at 1.2420.
Sterling pressured; Wall Street mixed as central banks navigate inflation uncertainty
Wall Street is trading mixed. Traders ignored data during the European session, as the construction PMI for the United Kingdom (UK) came in at 51.6 in May, exceeding the prior’s month reading of 51.1. Yet, the GBP/USD failed to gain traction as the US dollar rose.
Earlier in the North American session, the World Bank improved the economic outlook for the US, forecasting the economy will grow 1.1%, double January’s forecast of 0.5% in 2023. Even though it’s a good sign, projections for 2024 were slashed to 0.8%.
Meanwhile, the latest ISM PMIs release revealed that the economy is worsening as the manufacturing PMI contracted for the seven-straight month. Even though the services PMI expanded, the trend leans downward, increasing woes for a recession in the US.
Contrarily to weakening PMIs, was the latest jobs data, which further reinforces the thesis of doing more by the Federal Reserve. May Nonfarm Payrolls have added 339K jobs to the economy, portraying a resilient labor market. But the jump in the Unemployment Rate keeps the Fed at crossroads as it scrambles to curb sticky inflation at around double its target.
Given the backdrop, investors’ expectations for a hold at the June meeting lie at 76%, as shown by the CME FedWatch Tool. However, traders must be aware of the current week’s central banks’ monetary policy decisions amongst the G10, as the Reserve Bank of Australia (RBA) raised rates, while the Bank of Canada (BoC) took center stage on Wednesday. The latest round of inflation in Australia and Canada showed that inflation stabilized but later resumed upwards, pressuring the central banks.
GBP/USD Price Analysis: Technical outlook
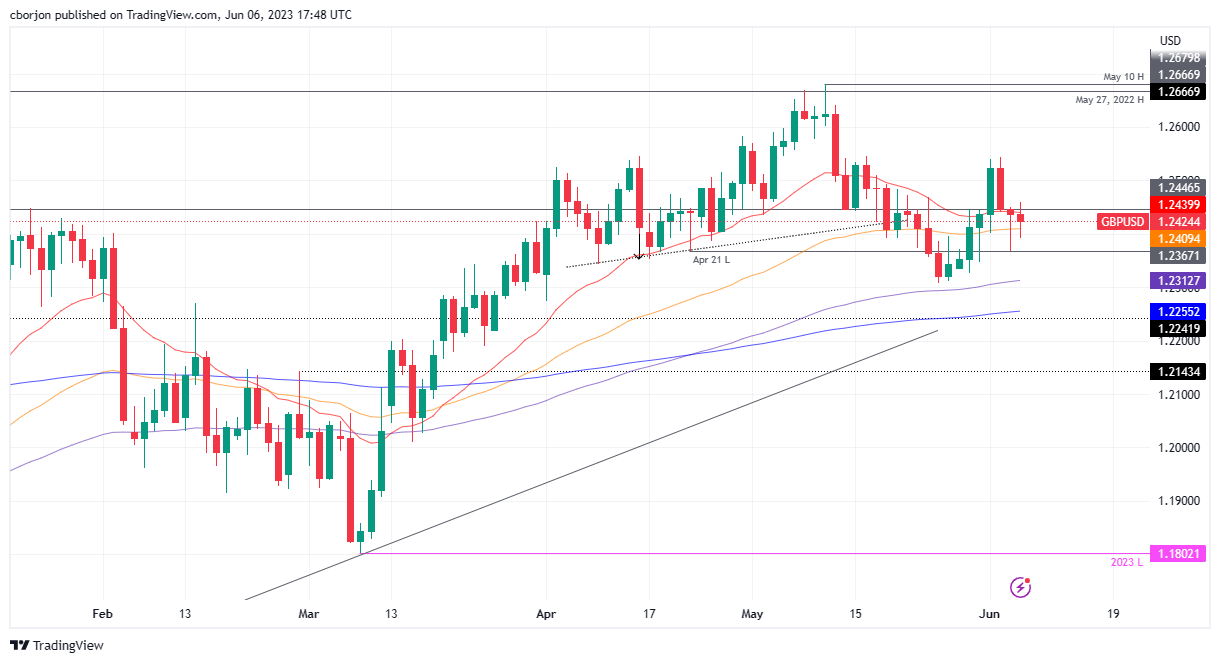
From a technical perspective, the GBP/USD remains supported by long-term daily EMAs below the exchange rate, depicting an uptrend but capped by the 20-day EMA at 1.2439. In addition, the 1.2500 handle is well defended by solid resistance with a bearish-harami formation around that area, which spurred a retracement from the late May rally, towards the June 2 high of 1.2544, before the ongoing pullback. Upside risks lie above 1.2459 and once cleared, the GBP/USD could test 1.2500. On the other hand, the GBP/USD could extend its losses below the 50-day EMA at 1.2409 and challenge the 100-day EMA at 1.2312.
Author

Christian Borjon Valencia
FXStreet
Markets analyst, news editor, and trading instructor with over 14 years of experience across FX, commodities, US equity indices, and global macro markets.















