GBP/USD slips below 1.34 as risk rally fades, US data disappoints
- Sterling drops 0.29% after failing to hold gains near YTD highs.
- US JOLTS and CB Confidence data miss forecasts, fueling Fed rate cut speculation.
- Traders brace for US Q1 GDP release, key for shaping Fed policy outlook.

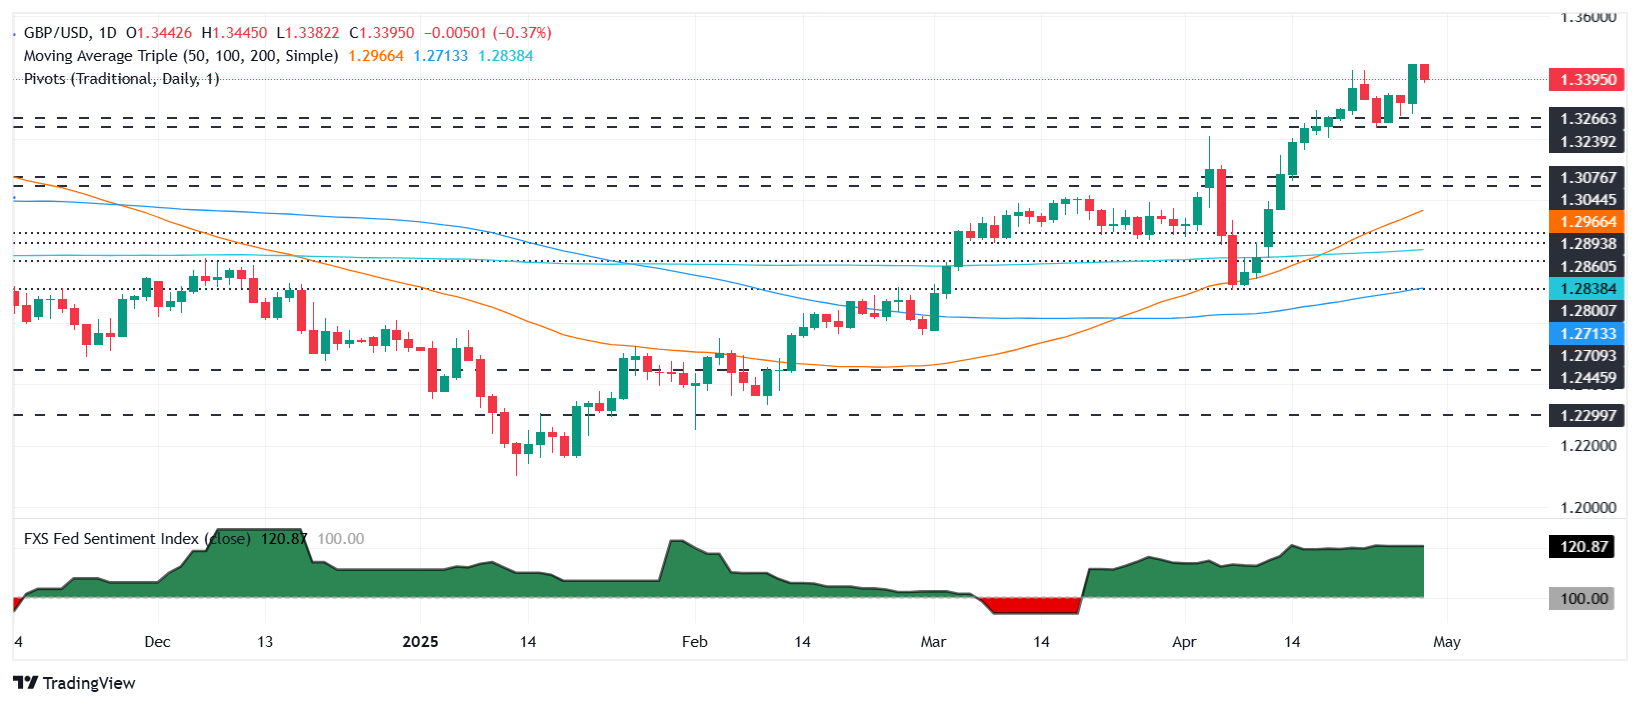
The Pound Sterling (GBP) depreciates against the US Dollar (USD) and falls after testing the year-to-date (YTD) high of 1.3443. However, it fails to remain above 1.34 as it extends its losses. At the time of writing, GBP/USD trades at 1.3379, down 0.29%.
GBP/USD retreats to 1.3379 as weaker US labor, confidence figures stir rate cut hopes but lift Dollar demand
Investor confidence seems to have improved as US Treasury yields tumbled following the release of worse-than-expected US data, which could warrant easier policy by the Federal Reserve.
US Jobs Labor and Turnover Survey (JOLTS) data in March fell to its lowest level since September, indicating weaker labor demand. The numbers dipped from 7.48 million to 7.192 million last month, below forecasts of 7.5 million. At the same time, the Conference Board (CB) slumped to a nearly five-year low in April, as confidence dropped from 93.9 to 86.0, below forecasts of 87.5.
In the meantime, some reports from Washington revealed that the Trump administration could reduce some tariffs linked to the automobile industry. However, the US-China trade war might continue influencing traders' sentiment.
Last week, United Kingdom (UK) Retail Sales data indicated that household spending remains solid. Nevertheless, weaker-than-expected PMI figures showed that businesses remain uncertain about US trade policies.
Ahead this week, traders are still eyeing the Gross Domestic Product (GDP) figures on Wednesday, with the median projecting the US economy grew 0.4% in Q1 2025.
GBP/USD Price Forecast: Technical outlook
GBP/USD continues to struggle to find acceptance above 1.34, as the pair climbed past the latter but failed to consolidate its gains. The pair fell to 1.3390, and if buyers fail to print a daily close above 1.34, expect a reversal and a challenge of the 20-day Simple Moving Average (SMA) at 1.3303.
British Pound PRICE This week
The table below shows the percentage change of British Pound (GBP) against listed major currencies this week. British Pound was the strongest against the New Zealand Dollar.
| USD | EUR | GBP | JPY | CAD | AUD | NZD | CHF | |
|---|---|---|---|---|---|---|---|---|
| USD | -0.26% | -0.60% | -0.94% | -0.09% | 0.20% | 0.32% | -0.69% | |
| EUR | 0.26% | -0.39% | -0.70% | 0.15% | 0.37% | 0.58% | -0.45% | |
| GBP | 0.60% | 0.39% | -0.32% | 0.57% | 0.75% | 0.97% | -0.04% | |
| JPY | 0.94% | 0.70% | 0.32% | 0.89% | 1.19% | -0.13% | 0.55% | |
| CAD | 0.09% | -0.15% | -0.57% | -0.89% | 0.17% | 0.41% | -0.59% | |
| AUD | -0.20% | -0.37% | -0.75% | -1.19% | -0.17% | 0.22% | -0.80% | |
| NZD | -0.32% | -0.58% | -0.97% | 0.13% | -0.41% | -0.22% | -1.01% | |
| CHF | 0.69% | 0.45% | 0.04% | -0.55% | 0.59% | 0.80% | 1.01% |
The heat map shows percentage changes of major currencies against each other. The base currency is picked from the left column, while the quote currency is picked from the top row. For example, if you pick the British Pound from the left column and move along the horizontal line to the US Dollar, the percentage change displayed in the box will represent GBP (base)/USD (quote).
Author

Christian Borjon Valencia
FXStreet
Markets analyst, news editor, and trading instructor with over 14 years of experience across FX, commodities, US equity indices, and global macro markets.

















