|

GBP/USD Price Analysis: Snaps two-day uptrend as 200-day EMA probes buyers

  • GBP/USD fades bounce off the five-week-old support line, mildly offered of late.
  • Bearish MACD signals suggest another attempt to break short-term support.
  • Monthly horizontal resistance, December’s peak adds to the upside barriers.

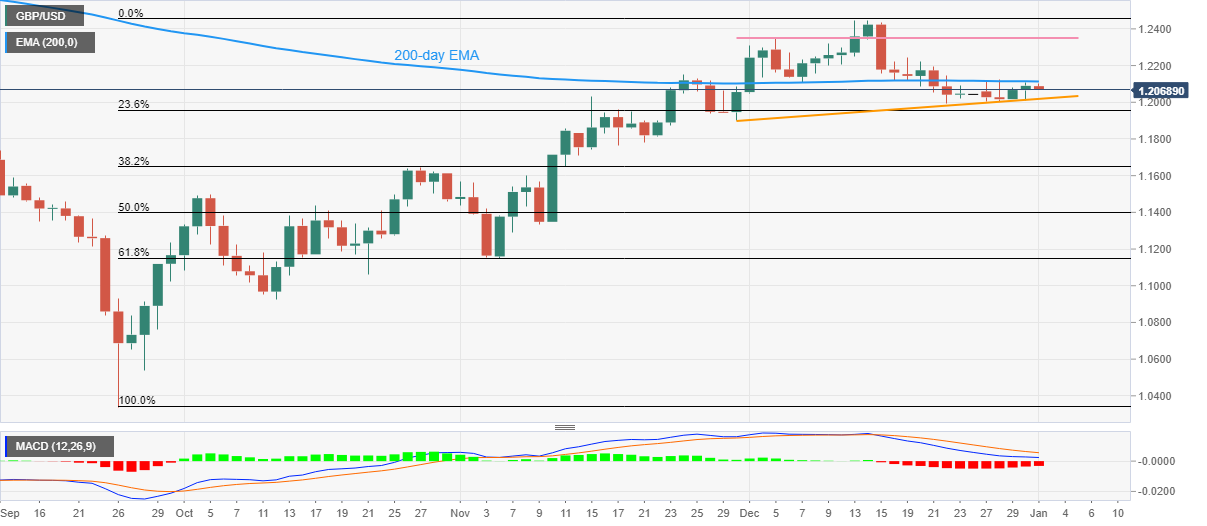
GBP/USD renews its intraday low near 1.2070 during the first loss-making day in three, despite the market’s inaction during early Monday.

In doing so, the Cable pair takes a U-turn from the 200-day Exponential Moving Average (EMA) to recall the bears. Also keeping the GBP/USD sellers hopeful are the bearish MACD signals,

It’s worth noting, however, that a one-month-old ascending support line, close to 1.2020 by the press time, restricts short-term GBP/USD downside.

Following that, the late November swing low near 1.1900 could act as the last defense of the GBP/USD.

In a case where GBP/USD remains bearish past 1.1900, the odds of witnessing a slump towards the 38.2% Fibonacci retracement level of September-December 2022 upside, near 1.1650, can’t be ruled out.

Alternatively, a clear upside break of the 200-day EMA level surrounding 1.2115 could propel GBP/USD towards a one-month-long resistance line, close to 1.2355 at the latest.

Should the GBP/USD bulls occupy the driver’s seat past 1.2355, the previous monthly peak surrounding 1.2450 should gain the market’s attention.

Overall, GBP/USD is likely to witness a downside but the room towards the south appears limited.

GBP/USD: Daily chart
Trend: Limited downside expected

Additional important levels

Overview
Today last price1.2069
Today Daily Change-0.0021
Today Daily Change %-0.17%
Today daily open1.209
 
Trends
Daily SMA201.2158
Daily SMA501.1906
Daily SMA1001.1667
Daily SMA2001.2046
 
Levels
Previous Daily High1.2108
Previous Daily Low1.201
Previous Weekly High1.2126
Previous Weekly Low1.2002
Previous Monthly High1.2447
Previous Monthly Low1.1992
Daily Fibonacci 38.2%1.207
Daily Fibonacci 61.8%1.2047
Daily Pivot Point S11.203
Daily Pivot Point S21.1971
Daily Pivot Point S31.1933
Daily Pivot Point R11.2128
Daily Pivot Point R21.2167
Daily Pivot Point R31.2226

Author

Anil Panchal

Anil Panchal

FXStreet

Anil Panchal has nearly 15 years of experience in tracking financial markets. With a keen interest in macroeconomics, Anil aptly tracks global news/updates and stays well-informed about the global financial moves and their implications.


More from Anil Panchal
Share:

Editor's Picks

AUD/USD seems vulnerable near 0.6800, 10-month low amid bullish USD

AUD/USD languishes near a 10-month low during the Asian session on Friday, awaiting a break below 0.6800 before the next leg up amid a bullish US Dollar. Firming Fed rate-hike expectations, along with fading hopes for US-Iran diplomacy, help the USD hold gains at its highest level since April 2025. Moreover, the RBA’s dovish tilt undermines the Aussie and backs the case for further losses.

USD/JPY bulls turn cautious near 160.00 amid intervention risks

USD/JPY enters a bullish consolidation phase around its highest level since early September as bulls turn cautious amid intervention risk near 160.00. Meanwhile, the downside seems cushioned as the wide US-Japan interest rate gap keeps the Yen carry trade active. Furthermore, the possibility of a jumbo Fed rate hike and Middle East uncertainties hold the US Dollar near a 19-month top, supporting the currency pair.


Gold remains on the back foot below $3,900

Gold now alternates gains with losses below the $3,900 mark per troy ounce on Friday. The precious metal struggles to regain traction amid the firmer US Dollar, mixed US Treasury yields and expectations of further tightening by the Fed at its December meeting.

Bitcoin just posted five straight losing weeks, and the storm may not be over yet

Bitcoin is struggling to find support, slipping below $70,000 as multiple headwinds threaten to push the Crypto King lower. The much-anticipated “Uptober” rally failed to materialize, with persistent selling pressure and widespread liquidations instead reinforcing the “Rektober” narrative.

Week ahead – Fed Minutes, inflation data and Nvidia earnings to guide investors

Fed minutes may add to hawkish tone as bets of 50-bps hike grow. Nvidia to report earnings as bar to impress high after spy scandal. Trade and geopolitics to be focal point of Trump-Xi summit.

Gold hit its lowest level of 2026 near $3,850
Gold (XAU/USD) attempts to stabilize around $3,890 on Friday after falling to $3,852 on Thursday, its lowest level since October 2025. The precious metal has lost more than 4% this week, as investors increasingly anticipate further monetary tightening from the Federal Reserve (Fed). The latest decline reflects a sharp change in market expectations.















