GBP/USD Price Forecast: Weakens and drops below 1.3400 as USD recovers
- GBP/USD drops to 1.3389 from a yearly high of 1.3429 as the US Dollar strengthens.
- Pullback to the top of an ascending channel at 1.3363 may offer buying opportunities, with RSI still favoring buyers.
- Maintaining above 1.3363 could push GBP/USD to retest the yearly high of 1.3429 and aim for 1.3437, 1.3450, and 1.3500.
- Falling below 1.3363 might lead to testing the week’s low at 1.3248 and further support at the September 19 low of 1.3153.

The Pound Sterling lost some steam against the US Dollar in early trading during Wednesday’s North American session after hitting a yearly peak of 1.3429. The GBP/USD trades at 1.3389, down 0.18%, as the Greenback recovers some ground.
GBP/USD Price Forecast: Technical outlook
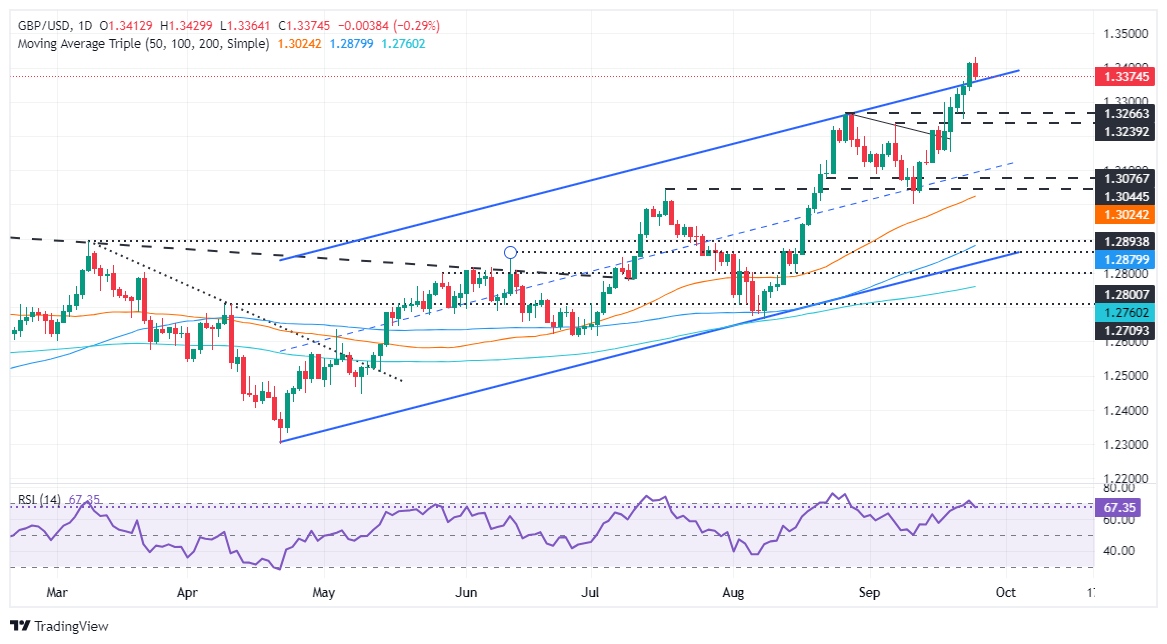
From a technical standpoint, the GBP/USD pullback toward the top of an ascending channel at 1.3363 opened the door for further buying, as seen by price action.
The Relative Strength Index (RSI) hints that buyers remain in charge. However, in the short term, the GBP/USD might print another leg-down before resuming its rally, which could put the March 1, 2022, peak at 1.3437 to the test.
If GBP/USD remains above 1.3363, this could pave the way to challenge the current yearly high of 1.3429. On further strength, that will expose 1.3437, followed by the 1.3450 figure, ahead of 1.3500.
Conversely, if the pair slumps past 1.3363, it could hit the current week’s low of 1.3248. On further weakness, the bulls’ following line of defense will be the September 19 daily low of 1.3153.
GBP/USD Price Action – Daily Chart
British Pound PRICE Today
The table below shows the percentage change of British Pound (GBP) against listed major currencies today. British Pound was the strongest against the Japanese Yen.
| USD | EUR | GBP | JPY | CAD | AUD | NZD | CHF | |
|---|---|---|---|---|---|---|---|---|
| USD | 0.06% | 0.29% | 0.79% | 0.20% | 0.43% | 0.60% | 0.66% | |
| EUR | -0.06% | 0.24% | 0.74% | 0.14% | 0.37% | 0.56% | 0.59% | |
| GBP | -0.29% | -0.24% | 0.48% | -0.10% | 0.13% | 0.28% | 0.36% | |
| JPY | -0.79% | -0.74% | -0.48% | -0.58% | -0.35% | -0.19% | -0.13% | |
| CAD | -0.20% | -0.14% | 0.10% | 0.58% | 0.23% | 0.41% | 0.46% | |
| AUD | -0.43% | -0.37% | -0.13% | 0.35% | -0.23% | 0.19% | 0.23% | |
| NZD | -0.60% | -0.56% | -0.28% | 0.19% | -0.41% | -0.19% | 0.05% | |
| CHF | -0.66% | -0.59% | -0.36% | 0.13% | -0.46% | -0.23% | -0.05% |
The heat map shows percentage changes of major currencies against each other. The base currency is picked from the left column, while the quote currency is picked from the top row. For example, if you pick the British Pound from the left column and move along the horizontal line to the US Dollar, the percentage change displayed in the box will represent GBP (base)/USD (quote).
Author

Christian Borjon Valencia
FXStreet
Markets analyst, news editor, and trading instructor with over 14 years of experience across FX, commodities, US equity indices, and global macro markets.


