GBP/USD Price Forecast: Trade below 1.3500; bullish bias remains ahead of US PCE data
- GBP/USD ticks lower amid the emergence of some USD dip-buying ahead of the US PCE Price Index.
- The divergent Fed-BoE policy expectations should help limit any meaningful downfall for the major.
- Traders might also opt to wait for the release of the US inflation report before placing fresh bets.

The GBP/USD pair attracts fresh sellers following the previous day's goodish rebound from the 1.3415 area, or the weekly low amid a modest US Dollar (USD) uptick. Spot prices currently trade around the 1.3475-1.3470 region, down 0.15% for the day, though the downside seems limited as traders might opt to wait for the release of the US Personal Consumption Expenditure (PCE) Price Index.
Heading into the key data risk, some repositioning trade assists the USD to regain positive traction following the previous day's dramatic turnaround from over a one-week high and exerts some pressure on the GBP/USD pair. However, bets that the Federal Reserve (Fed) will lower borrowing costs further in 2025 and US fiscal concerns might cap the USD. Furthermore, speculations that the Bank of England (BoE) would pause at its next meeting on June 18 and take its time before lowering borrowing costs further should act as a tailwind for the British Pound (GBP).
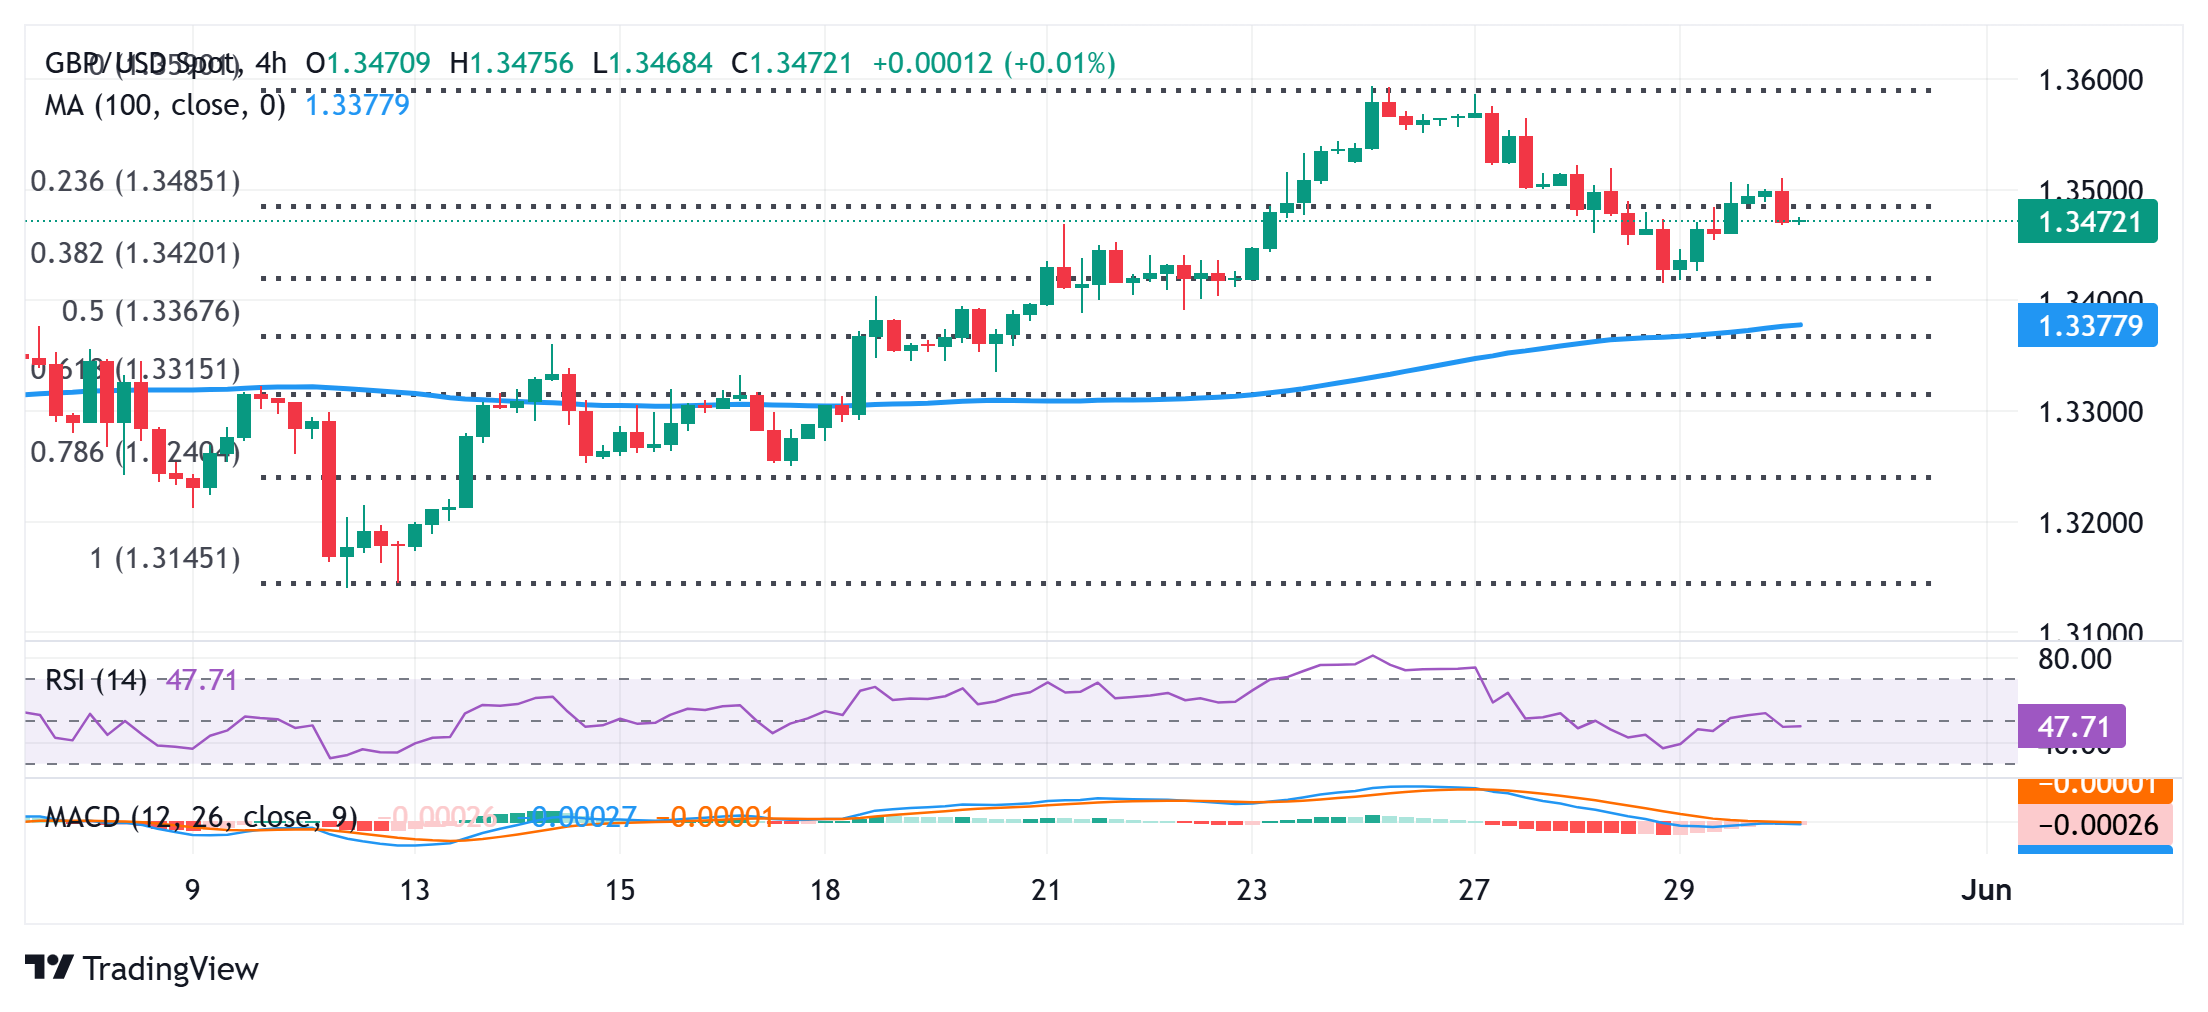
Meanwhile, oscillators on hourly charts have been gaining some negative traction and back the case for a further intraday slide. However, technical indicators on the daily chart are holding comfortably in positive territory. Moreover, the overnight bounce from the 38.2% Fibonacci retracement level of the recent move up from the monthly low favors the GBP/USD bulls. Hence, any subsequent fall might still be seen as a buying opportunity near the 1.3425-1.3415 region, which if broken might prompt some technical selling and pave the way for deeper losses.
The GBP/USD pair might then extend this week's corrective pullback from the 1.3600 neighborhood – the highest level since February 2022 – and test the 1.3375-1.3370 confluence. The latter comprises the 100-period Simple Moving Average (SMA) on the daily chart and the 50% Fibo. level, which, in turn, should act as a key pivotal point. A convincing break below will negate the near-term constructive outlook and shift the bias in favor of bearish traders, which should set the stage for a slide towards the 1.3300 mark, or the 61.8% Fibo. retracement level.
On the flip side, bulls might need to wait for sustained strength and acceptance above the 1.3500 psychological mark before placing fresh bets. The GBP/USD pair might then climb to the next relevant hurdle near the 1.3540-1.3545 region and then make a fresh attempt towards conquering the 1.3600 round figure. Some follow-through buying will be seen as a fresh trigger for bullish traders and set the stage for the resumption of a two-month-old uptrend.
GBP/USD 4-hour chart
Economic Indicator
Core Personal Consumption Expenditures - Price Index (YoY)
The Core Personal Consumption Expenditures (PCE), released by the US Bureau of Economic Analysis on a monthly basis, measures the changes in the prices of goods and services purchased by consumers in the United States (US). The PCE Price Index is also the Federal Reserve’s (Fed) preferred gauge of inflation. The YoY reading compares the prices of goods in the reference month to the same month a year earlier. The core reading excludes the so-called more volatile food and energy components to give a more accurate measurement of price pressures." Generally, a high reading is bullish for the US Dollar (USD), while a low reading is bearish.
Read more.Next release: Fri May 30, 2025 12:30
Frequency: Monthly
Consensus: 2.5%
Previous: 2.6%
Source: US Bureau of Economic Analysis
After publishing the GDP report, the US Bureau of Economic Analysis releases the Personal Consumption Expenditures (PCE) Price Index data alongside the monthly changes in Personal Spending and Personal Income. FOMC policymakers use the annual Core PCE Price Index, which excludes volatile food and energy prices, as their primary gauge of inflation. A stronger-than-expected reading could help the USD outperform its rivals as it would hint at a possible hawkish shift in the Fed’s forward guidance and vice versa.
Author

Haresh Menghani
FXStreet
Haresh Menghani is a detail-oriented professional with 10+ years of extensive experience in analysing the global financial markets.