|

GBP/USD Price Forecast: Touches new yearly high but diverging with momentum

  • GBP/USD rallies to new high for 2024 on Thursday. The trend is bullish. 
  • A bearish divergence with momentum, however, indicates an increased risk of a temporary setback. 

GBP/USD has rallied to a new high for 2024 on Thursday; the pair reached 1.3314 during trading on Thursday, its highest price for the year. 

The short, medium and long-term trends are bullish suggesting the current is flowing north. It is a principle of technical analysis that “the trend is your friend” so the odds favor still more upside. 

GBP/USD Daily Chart
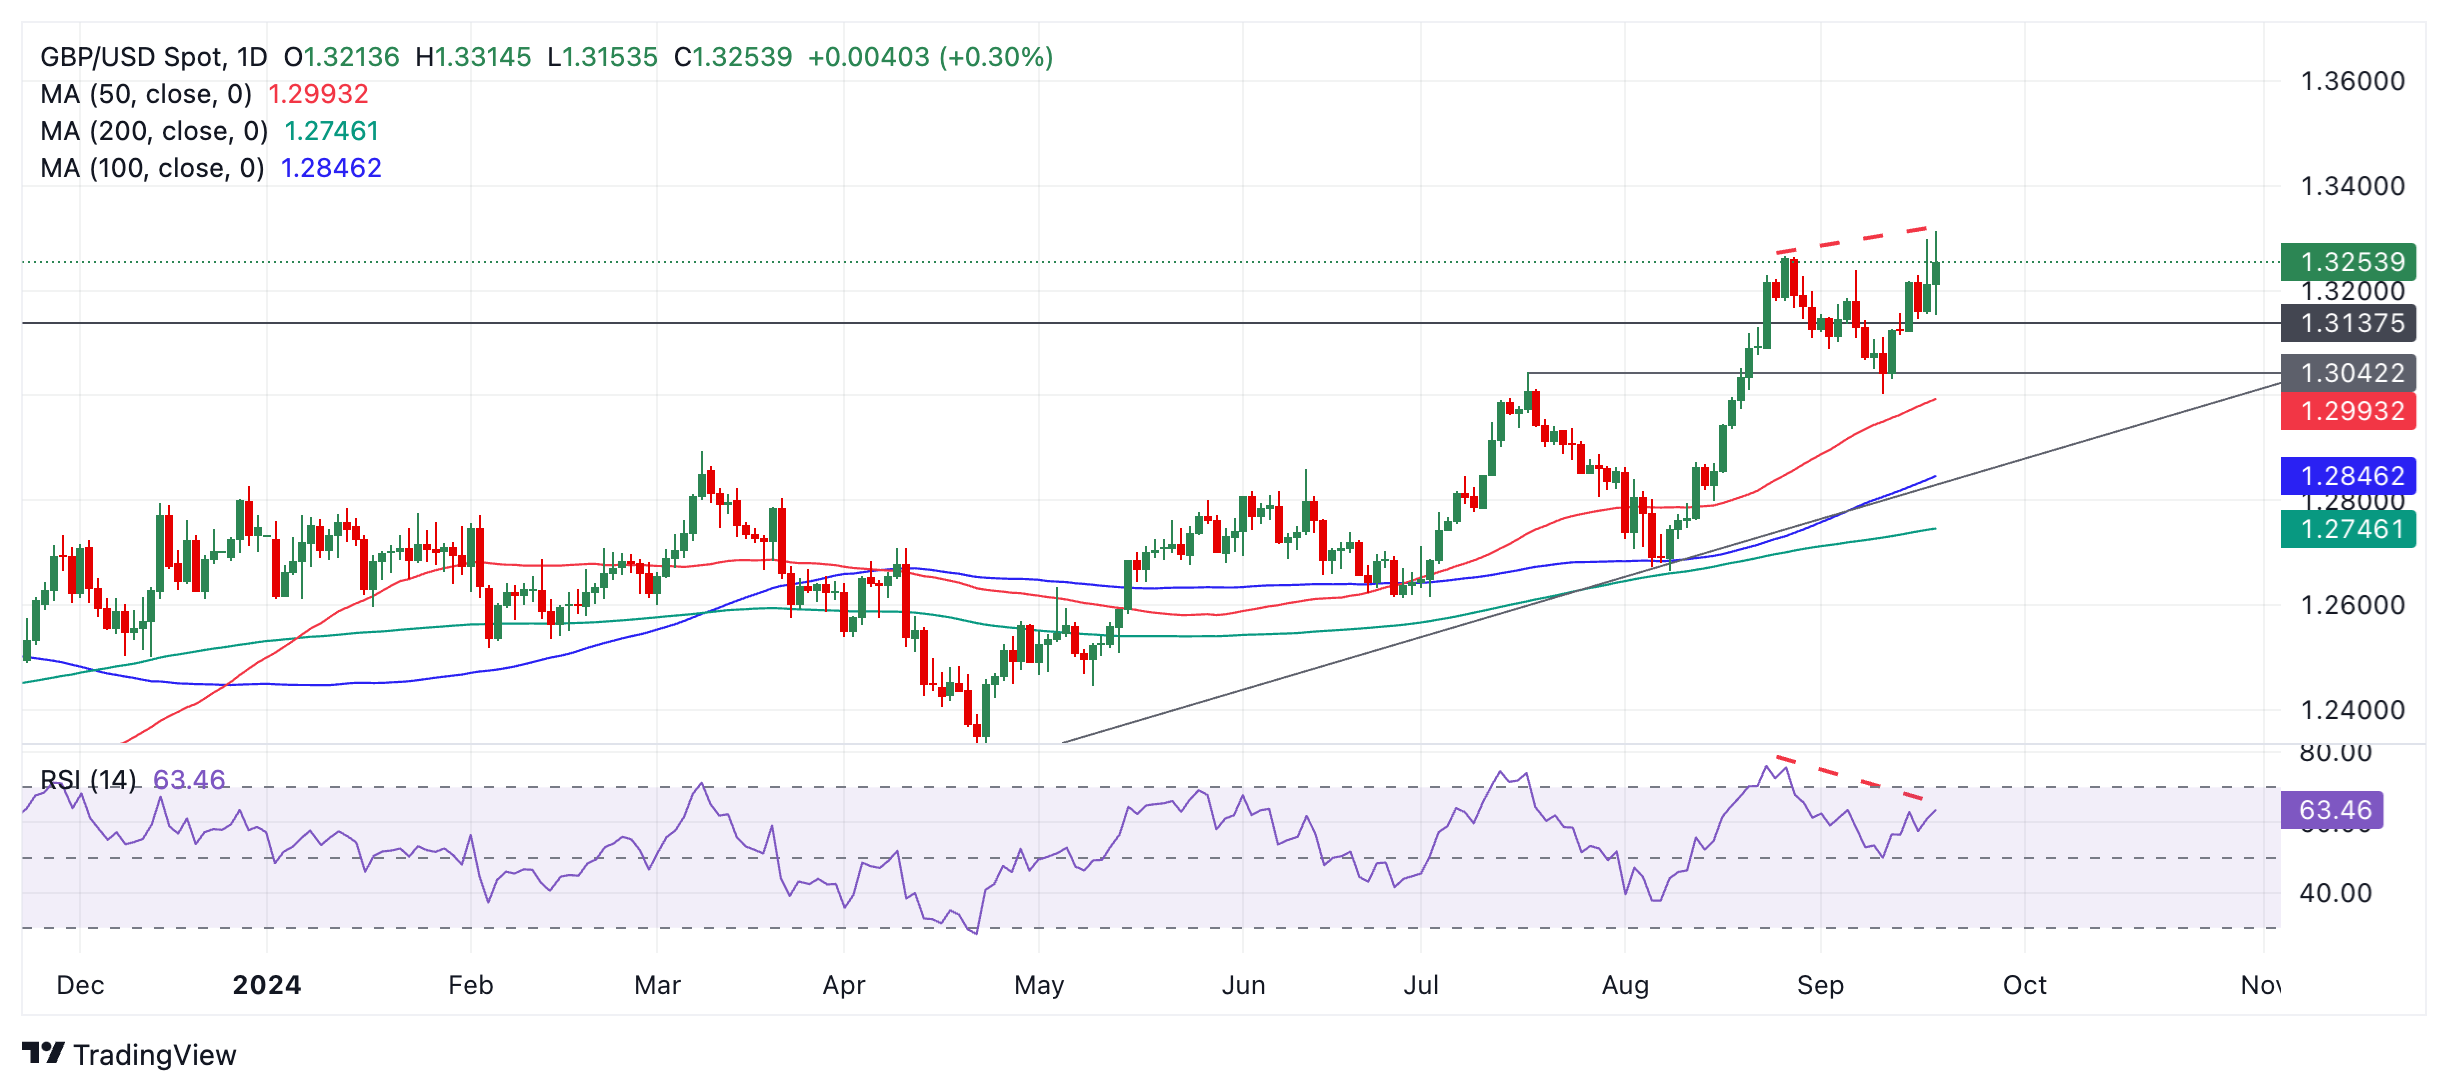
A break above 1.3314 would confirm more upside, targeting 1.3350 and then 1.3400. 

However, price is showing bearish divergence with the Relative Strength Index (RSI) momentum indicator (red dashed lines on chart above). This happens when the price reaches a new high but the RSI does not. The non confirmation is a bearish sign as it indicates underlying weakness. There is an increased risk GBP/USD could pull back. 

If the pair pulls back it will probably only be temporary as all three trend timeframes are bullish. Support at 1.3137 is likely to catch falling prices, or if not at 1.3042 (July 18 high).

Author

Joaquin Monfort

Joaquin Monfort is a financial writer and analyst with over 10 years experience writing about financial markets and alt data. He holds a degree in Anthropology from London University and a Diploma in Technical analysis.


More from Joaquin Monfort
Share:

Editor's Picks

AUD/USD sits at two-month lows near 0.6950 after Australian CPI data

AUD/USD is sitting at two-month lows near 0.6950 in the Asian session on Wednesday, as below-expectations August Australian underlying CPI data pours cold water on expectations for further RBA interest rate hikes. Chinese PMI data also fail to inspire the Australian Dollar, despite a pause in the US Dollar advance.

USD/JPY stays weak below 157.00 amid Japanese intervention risks

USD/JPY keeps losses below 157.00 in the Asian session on Wednesday, as hawkish BoJ expectations, along with intervention risks, underpin the Japanese Yen, countering dismal domestic factory output and retail sales data. Meanwhile, a broad US Dollar retreat also collaborates to the pair's downside.

Gold eyes US PCE inflation data for next move

Gold is consolidating the previous rebound from an eight-week low of $4,110 in Asia on Wednesday, although it remains below $4,200 ahead of the US ADP jobs report and core Personal Consumption Expenditures Price Index data.   


QNT tally nears $300 as Quant takes center stage at Sibos 2026
Quant (QNT) maintains a strong bullish trend, trading around $290 on Wednesday, with bulls aiming to break above $300. The Ethereum-based protocol takes the stage at SWIFT's Sibos 2026 event, demonstrating how Capgemini AI agents help address treasury liquidity shortfalls using Quant's tokenized deposits.
Warning: The RBI's October rate hike may be too late as oil risks mount
The Indian Rupee (INR) is one of the worst-performing Asian currencies in 2026, down about 6.5% year-to-date against the US Dollar (USD) and trading near historic lows ahead of the October 5–7 Reserve Bank of India (RBI) meeting. Economists expect the RBI to raise its repo rate by 25 basis points (bps) next month and follow up with another increase in December to counter rising retail inflation.
Silver is more volatile than Gold ahead of PCE and NFP. This chart shows the positioning gap
The market’s attention is focused on American data this week, but there’s something only those with a trained eye may be looking at: Gold and Silver positioning gap. Financial markets are moving on fears, mostly related to persistently high energy prices driven by the Middle East war. Sure, the US Dollar (USD) is strong, but at what cost?