GBP/USD Price Forecast: Stumbles below 1.2900 on risk-off mood
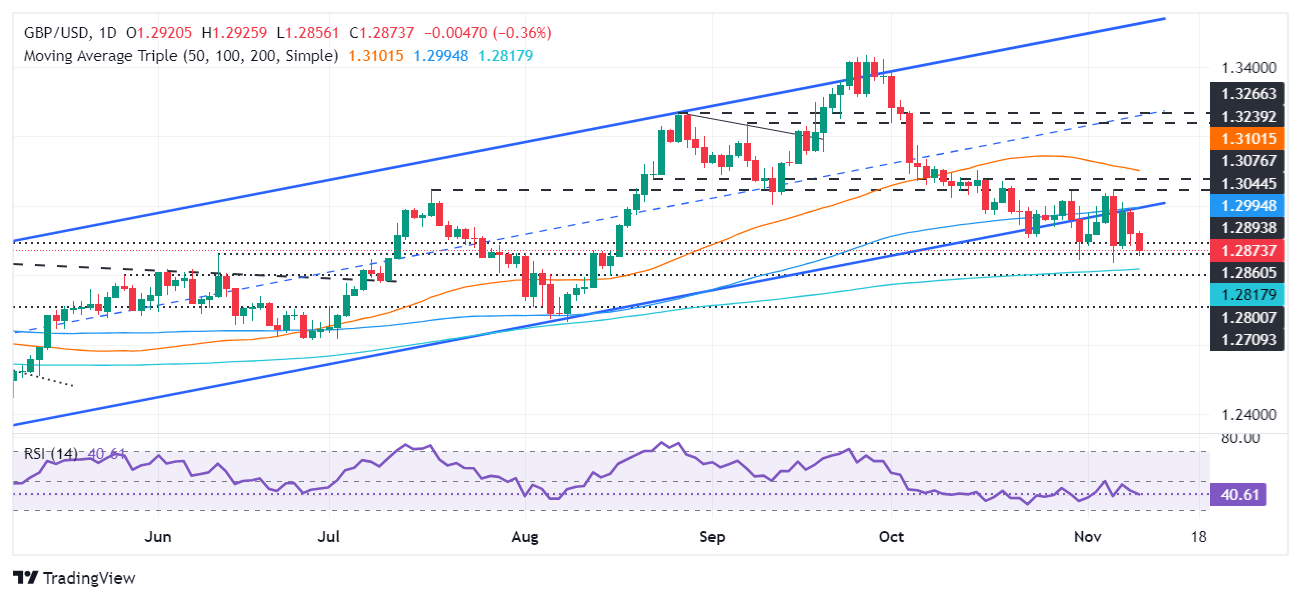
- GBP/USD tilts downward; key support at 1.2833 could open path to 200-day SMA at 1.2816.
- Break below major support may shift bias bearish, targeting August low of 1.2664.
- Buyers need a close above 100-day SMA at 1.2992 to regain momentum toward 1.3099.

The Pound Sterling begins the week on the back foot, tumbling over 0.30% against the Greenback amid fears that US President-Elect Donald Trump might impose tariffs, deteriorated risk appetite. Hence, the risk-sensitive GBP/USD pair fell below the 1.2900 figure, trading at 1.2876.
GBP/USD Price Forecast: Technical outlook
From a technical perspective, the GBP/USD remains consolidated but slightly tilted to the downside. However, sellers must clear the November 6 swing low of 1.2833 to challenge the 200-day Simple Moving Average (SMA) at 1.2816. If those two support levels are cleared, the bias will shift bearish, and the pair can challenge major support at the August 9 daily low of 1.2664.
Conversely, GBP buyers need to lift the major above the 100-day SMA at 1.2992, shy of 1.30. Once surpassed, that could pave the way to testing the 50-day SMA at 1.3099.
Momentum remains bearishly biased as seen by the Relative Strength Index (RSI). Still it consolidated at around familiar levels, hinting that sellers are not fully in charge.
GBP/USD Price Chart – Daily
British Pound PRICE Today
The table below shows the percentage change of British Pound (GBP) against listed major currencies today. British Pound was the strongest against the Japanese Yen.
| USD | EUR | GBP | JPY | CAD | AUD | NZD | CHF | |
|---|---|---|---|---|---|---|---|---|
| USD | 0.62% | 0.35% | 0.68% | 0.27% | 0.11% | -0.02% | 0.39% | |
| EUR | -0.62% | -0.29% | 0.15% | -0.24% | -0.42% | -0.54% | -0.15% | |
| GBP | -0.35% | 0.29% | 0.36% | 0.06% | -0.13% | -0.25% | 0.15% | |
| JPY | -0.68% | -0.15% | -0.36% | -0.41% | -0.64% | -0.60% | -0.28% | |
| CAD | -0.27% | 0.24% | -0.06% | 0.41% | -0.12% | -0.30% | 0.09% | |
| AUD | -0.11% | 0.42% | 0.13% | 0.64% | 0.12% | -0.15% | 0.27% | |
| NZD | 0.02% | 0.54% | 0.25% | 0.60% | 0.30% | 0.15% | 0.39% | |
| CHF | -0.39% | 0.15% | -0.15% | 0.28% | -0.09% | -0.27% | -0.39% |
The heat map shows percentage changes of major currencies against each other. The base currency is picked from the left column, while the quote currency is picked from the top row. For example, if you pick the British Pound from the left column and move along the horizontal line to the US Dollar, the percentage change displayed in the box will represent GBP (base)/USD (quote).
Author

Christian Borjon Valencia
FXStreet
Markets analyst, news editor, and trading instructor with over 14 years of experience across FX, commodities, US equity indices, and global macro markets.


