GBP/USD Price Forecast: Rises toward 1.3400 barrier near seven-month highs
- GBP/USD could encounter primary resistance at the psychological level of 1.3400
- The 14-day RSI moves above 70, suggesting a potential downside correction may be on the horizon.
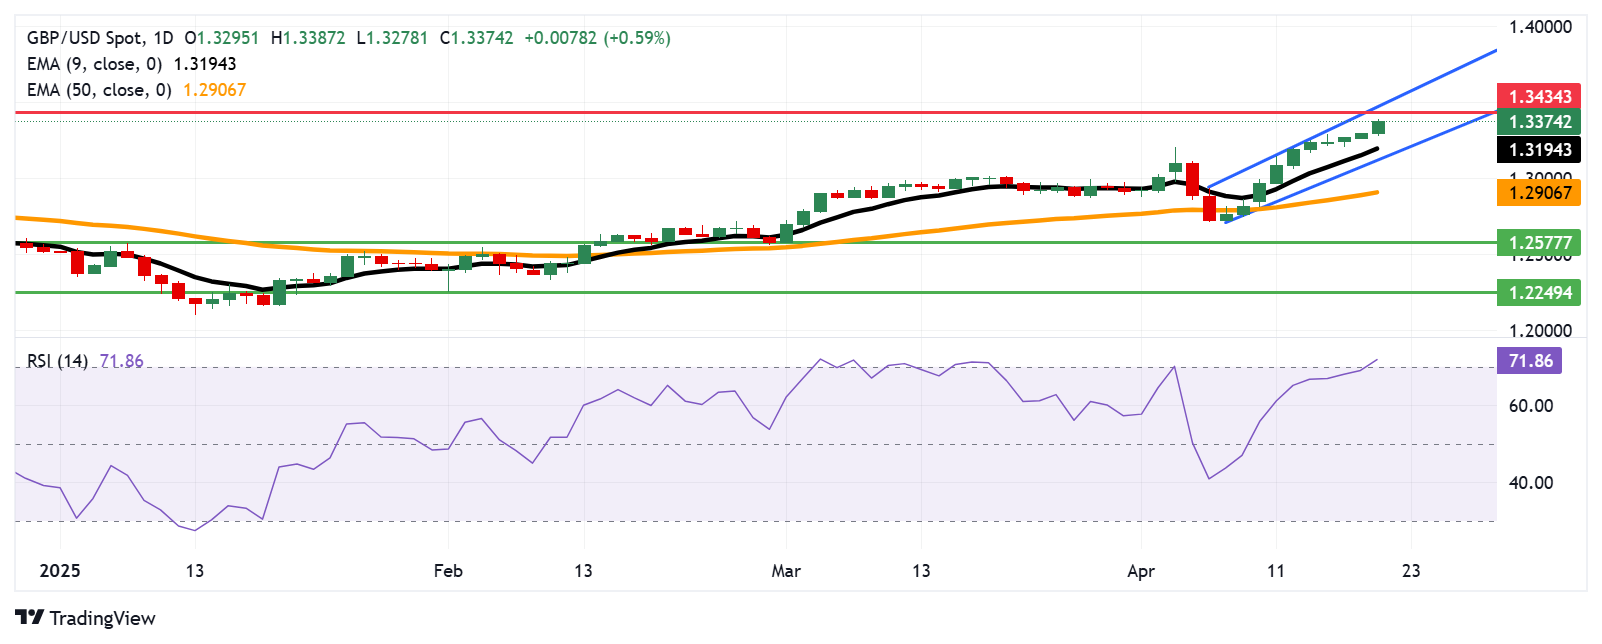
- The immediate support lies at the nine-day EMA, near 1.3194, followed by the ascending channel’s lower boundary around 1.3150.

The GBP/USD pair continues its winning streak that began on April 8, trading around 1.3370 during the Asian hours on Monday. Daily chart technical analysis points to a continued bullish trend, with the pair advancing within an ascending channel pattern.
Additionally, the GBP/USD pair continues to trade above the nine-day Exponential Moving Average (EMA), reinforcing the short-term bullish momentum. However, the 14-day Relative Strength Index (RSI) has climbed above 70, indicating overbought conditions and suggesting a potential downside correction may be on the horizon.
The GBP/USD pair encounters initial resistance at the psychological level of 1.3400, followed by 1.3434 — a level not seen since September 2024 and the lowest since March 2022. A sustained move higher could reinforce the bullish bias, with the pair potentially targeting the ascending channel’s upper boundary near 1.3480.
On the downside, immediate support is seen at the nine-day EMA, around 1.3194, followed by the ascending channel’s lower boundary near 1.3150. A break below this crucial area could undermine short-term bullish momentum, with the 50-day EMA at 1.2906 emerging as the next significant support level.
A deeper decline below this level could dent the medium-term bullish outlook, potentially driving the GBP/USD pair toward the two-month low of 1.2577, recorded on March 3, and further down to the three-month low of 1.2249, registered on February 3.
GBP/USD: Daily Chart
British Pound PRICE Today
The table below shows the percentage change of British Pound (GBP) against listed major currencies today. British Pound was the strongest against the US Dollar.
| USD | EUR | GBP | JPY | CAD | AUD | NZD | CHF | |
|---|---|---|---|---|---|---|---|---|
| USD | -1.03% | -0.63% | -0.86% | -0.36% | -0.51% | -1.04% | -0.96% | |
| EUR | 1.03% | 0.25% | 0.15% | 0.63% | 0.33% | -0.04% | 0.05% | |
| GBP | 0.63% | -0.25% | 0.08% | 0.40% | 0.08% | -0.29% | -0.20% | |
| JPY | 0.86% | -0.15% | -0.08% | 0.50% | 0.21% | -0.07% | -0.07% | |
| CAD | 0.36% | -0.63% | -0.40% | -0.50% | -0.27% | -0.68% | -0.58% | |
| AUD | 0.51% | -0.33% | -0.08% | -0.21% | 0.27% | -0.36% | -0.28% | |
| NZD | 1.04% | 0.04% | 0.29% | 0.07% | 0.68% | 0.36% | 0.12% | |
| CHF | 0.96% | -0.05% | 0.20% | 0.07% | 0.58% | 0.28% | -0.12% |
The heat map shows percentage changes of major currencies against each other. The base currency is picked from the left column, while the quote currency is picked from the top row. For example, if you pick the British Pound from the left column and move along the horizontal line to the US Dollar, the percentage change displayed in the box will represent GBP (base)/USD (quote).
Author

Akhtar Faruqui
FXStreet
Akhtar Faruqui is a Forex Analyst based in New Delhi, India. With a keen eye for market trends and a passion for dissecting complex financial dynamics, he is dedicated to delivering accurate and insightful Forex news and analysis.


