GBP/USD Price Forecast: Attempts to recover from 1.2600 as it enters oversold zone
- GBP/USD rebounds from oversold zone amid potential bullish reversal.
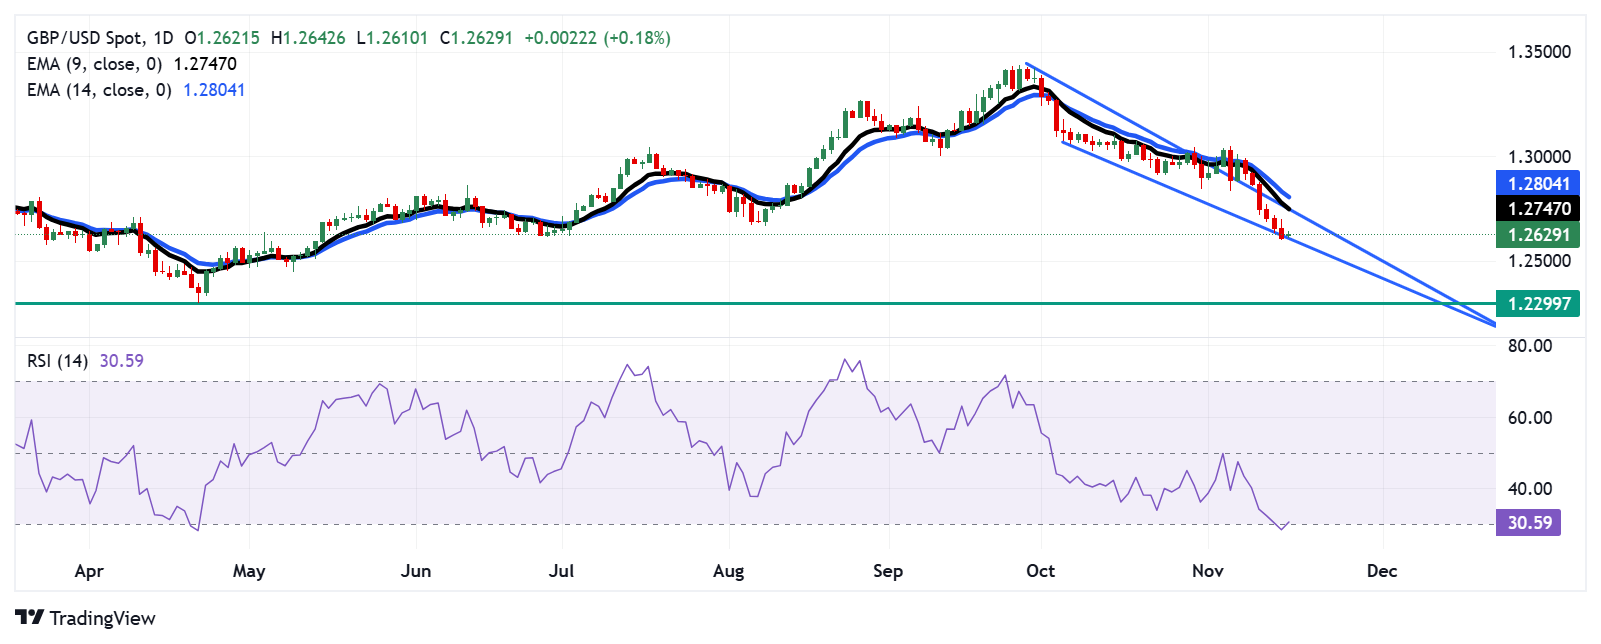
- The lower boundary of the descending wedge at the psychological level of 1.2600 acts as the primary support.
- The pair may approach the upper boundary of the descending wedge, aligned with the nine-day EMA at 1.2746 level.

GBP/USD breaks its six-day losing streak, trading around 1.2630 during the Asian hours on Monday. The daily chart analysis shows the sellers' control weakens as the pair moves downwards within the descending wedge pattern. This signals a potential bullish reversal for the pair.
Additionally, the 14-day Relative Strength Index (RSI) is at the 30 level, suggesting an oversold situation for the pair and a potential for an upward correction as soon as possible.
On the downside, the GBP/USD pair seems to test the lower boundary of the descending wedge at the psychological level of 1.2600. A break below this level would reinforce the bearish bias and put downward pressure on the pair to navigate the region around the yearly low at 1.2299, which was recorded on April 22.
For resistance, the GBP/USD pair could test the upper boundary of the descending wedge, aligned with the nine-day Exponential Moving Average (EMA) at 1.2746 level. Further barrier appears at the psychological level of 1.2800, aligned with the 14-day EMA at 1.2804 level.
GBP/USD: Daily Chart
British Pound PRICE Today
The table below shows the percentage change of British Pound (GBP) against listed major currencies today. British Pound was the strongest against the Japanese Yen.
| USD | EUR | GBP | JPY | CAD | AUD | NZD | CHF | |
|---|---|---|---|---|---|---|---|---|
| USD | 0.04% | -0.05% | 0.34% | -0.03% | -0.09% | 0.14% | -0.02% | |
| EUR | -0.04% | 0.08% | 0.42% | 0.05% | 0.02% | 0.22% | 0.06% | |
| GBP | 0.05% | -0.08% | 0.37% | -0.03% | -0.07% | 0.14% | -0.02% | |
| JPY | -0.34% | -0.42% | -0.37% | -0.38% | -0.36% | -0.14% | -0.29% | |
| CAD | 0.03% | -0.05% | 0.03% | 0.38% | -0.04% | 0.17% | 0.01% | |
| AUD | 0.09% | -0.02% | 0.07% | 0.36% | 0.04% | 0.20% | 0.04% | |
| NZD | -0.14% | -0.22% | -0.14% | 0.14% | -0.17% | -0.20% | -0.15% | |
| CHF | 0.02% | -0.06% | 0.02% | 0.29% | -0.01% | -0.04% | 0.15% |
The heat map shows percentage changes of major currencies against each other. The base currency is picked from the left column, while the quote currency is picked from the top row. For example, if you pick the British Pound from the left column and move along the horizontal line to the US Dollar, the percentage change displayed in the box will represent GBP (base)/USD (quote).
Author

Akhtar Faruqui
FXStreet
Akhtar Faruqui is a Forex Analyst based in New Delhi, India. With a keen eye for market trends and a passion for dissecting complex financial dynamics, he is dedicated to delivering accurate and insightful Forex news and analysis.


