GBP/USD Price Forecast: Hits yearly high above 1.3350 amid soft US-UK data
- GBP/USD climbs as Flash PMIs from both UK and US indicate economic deceleration.
- The pair’s uptrend tests the top of an ascending channel, nearing key resistance at 1.3400.
- A dip below 1.3300 might prompt a correction to 1.3248 and 1.3200, with further supports at 1.3100 and 1.3001.

The Pound Sterling soars to new 2024 record high of 1.3355 versus the Greenback on Monday, rising over 0.20% as S&P Global Flash PMIs in the UK and the US show that both economies are slowing. Meanwhile, dovish comments by Chicago’s Fed President Austan Goolsbee weighed on the buck. The GBP/USD trades at 1.3350.
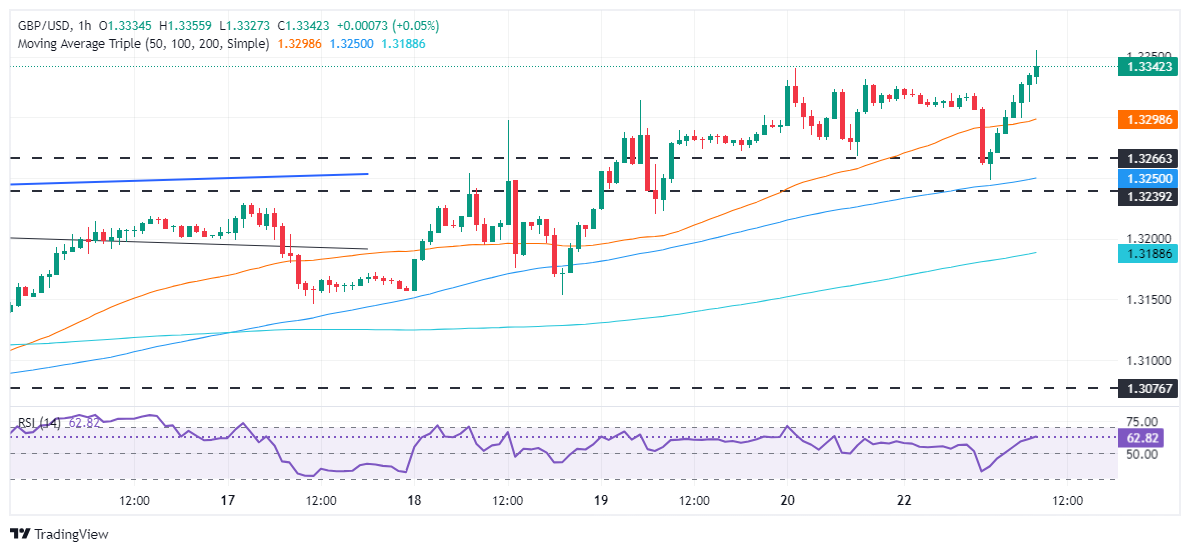
GBP/USD Price Forecast: Technical outlook
The GBP/USD daily chart hints that the uptrend is accelerating. It is testing the top of an ascending channel, which, if cleared, could pave the way to challenging the 1.3400 psychological figure.
The Relative Strength Index (RSI) portrays momentum favoring buyers. Hence, the GBP/USD might extend its gains in the short term.
If GBP/USD cleared 1.3400, the next resistance would be the March 1, 2022 peak at 1.3437. Once surpassed, the next ceiling level would be 1.3450, ahead of 1.3500.
Conversely, if GBP/USD retraces below 1.3300, this could pave the way for a correction. The first support will be the September 23 low of 1.3248, followed by the 1.3200 figure. On further weakness, the next stop wil be 1.3100, before diving to 1.3001 the September 11 cycle low.
GBP/USD Price Action – Daily Chart
British Pound PRICE Today
The table below shows the percentage change of British Pound (GBP) against listed major currencies today. British Pound was the strongest against the Euro.
| USD | EUR | GBP | JPY | CAD | AUD | NZD | CHF | |
|---|---|---|---|---|---|---|---|---|
| USD | 0.25% | -0.14% | -0.13% | -0.41% | -0.53% | -0.47% | -0.18% | |
| EUR | -0.25% | -0.44% | -0.37% | -0.65% | -0.85% | -0.71% | -0.43% | |
| GBP | 0.14% | 0.44% | 0.15% | -0.20% | -0.41% | -0.27% | -0.00% | |
| JPY | 0.13% | 0.37% | -0.15% | -0.29% | -0.50% | -0.34% | -0.17% | |
| CAD | 0.41% | 0.65% | 0.20% | 0.29% | -0.07% | -0.06% | 0.21% | |
| AUD | 0.53% | 0.85% | 0.41% | 0.50% | 0.07% | 0.15% | 0.41% | |
| NZD | 0.47% | 0.71% | 0.27% | 0.34% | 0.06% | -0.15% | 0.27% | |
| CHF | 0.18% | 0.43% | 0.00% | 0.17% | -0.21% | -0.41% | -0.27% |
The heat map shows percentage changes of major currencies against each other. The base currency is picked from the left column, while the quote currency is picked from the top row. For example, if you pick the British Pound from the left column and move along the horizontal line to the US Dollar, the percentage change displayed in the box will represent GBP (base)/USD (quote).
Author

Christian Borjon Valencia
FXStreet
Markets analyst, news editor, and trading instructor with over 14 years of experience across FX, commodities, US equity indices, and global macro markets.


