GBP/USD Price Forecast: Falls below 1.3350 due to prevailing bearish bias
- GBP/USD may find the initial support at the descending channel’s lower boundary around 1.3250.
- The 14-day Relative Strength Index remains below the 50 level, reinforcing the bearish bias.
- The initial barrier appears at the nine-day EMA of 1.3441.

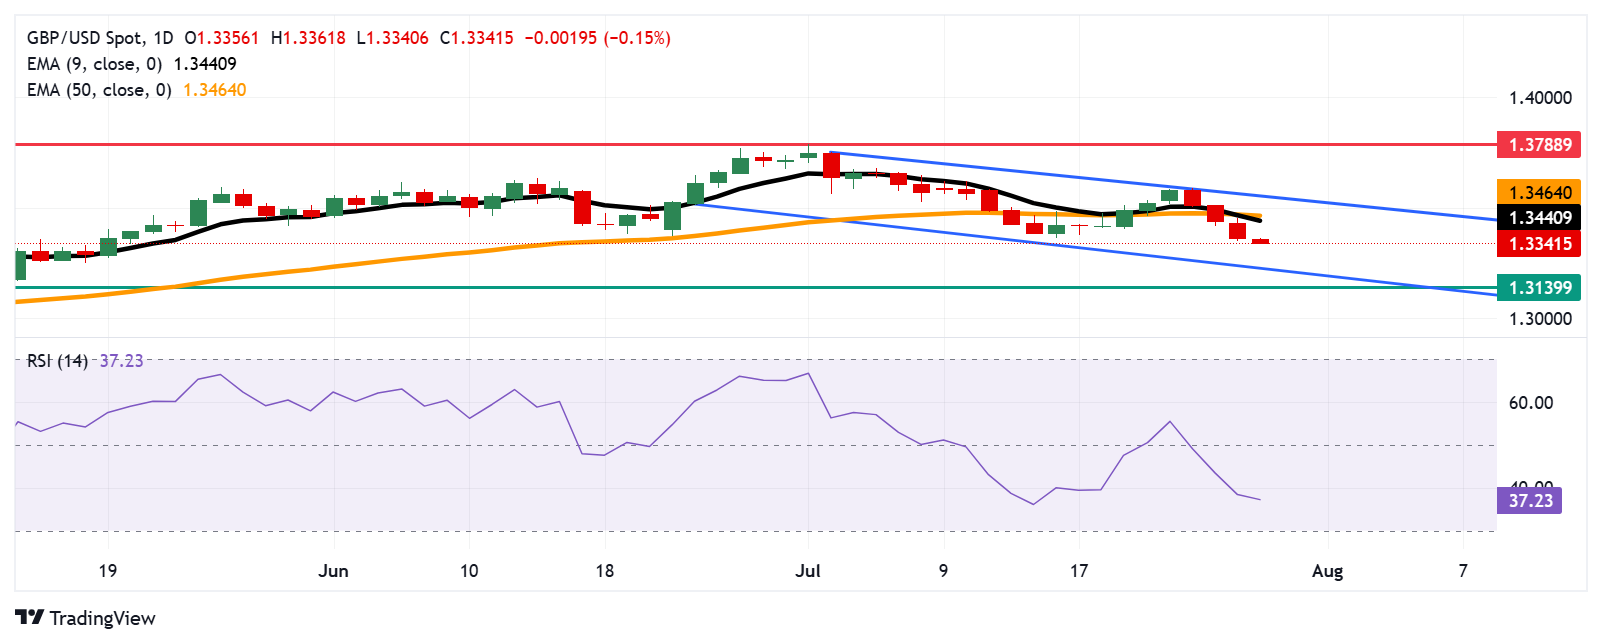
The GBP/USD pair extends its losing streak for the fourth successive session, trading around 1.3340 during the Asian hours on Tuesday. The bearish bias prevails as the daily chart’s technical analysis suggests that the pair remains within the descending channel pattern.
The 14-day Relative Strength Index (RSI) remains below the 50 level, strengthening the bearish bias. However, the GBP/USD pair is positioned below the nine-day Exponential Moving Average (EMA), suggesting the short-term price momentum is weaker.
On the downside, the GBP/USD pair could target the primary support at the lower boundary of the descending channel around 1.3250. A break below the channel could strengthen the bearish bias and put downward pressure on the pair to test the three-month low of 1.3139.
The GBP/USD pair may find an immediate barrier at the nine-day EMA of 1.3440, followed by the 50-day EMA at 1.3464. A break above these levels would improve the short- and medium-term price momentum and support the pair to test the descending channel’s upper boundary around 1.3570. Further advances may lead the pair to approach 1.3788, the highest since October 2021, which was recorded on July 1.
GBP/USD: Daily Chart
British Pound PRICE Today
The table below shows the percentage change of British Pound (GBP) against listed major currencies today. British Pound was the weakest against the Japanese Yen.
| USD | EUR | GBP | JPY | CAD | AUD | NZD | CHF | |
|---|---|---|---|---|---|---|---|---|
| USD | 0.08% | 0.11% | -0.09% | -0.02% | -0.03% | 0.14% | 0.05% | |
| EUR | -0.08% | 0.02% | -0.19% | -0.09% | -0.09% | -0.05% | -0.01% | |
| GBP | -0.11% | -0.02% | -0.22% | -0.12% | -0.11% | -0.06% | -0.04% | |
| JPY | 0.09% | 0.19% | 0.22% | 0.05% | 0.04% | 0.14% | 0.23% | |
| CAD | 0.02% | 0.09% | 0.12% | -0.05% | -0.07% | 0.16% | 0.07% | |
| AUD | 0.03% | 0.09% | 0.11% | -0.04% | 0.07% | 0.06% | 0.06% | |
| NZD | -0.14% | 0.05% | 0.06% | -0.14% | -0.16% | -0.06% | 0.01% | |
| CHF | -0.05% | 0.00% | 0.04% | -0.23% | -0.07% | -0.06% | -0.01% |
The heat map shows percentage changes of major currencies against each other. The base currency is picked from the left column, while the quote currency is picked from the top row. For example, if you pick the British Pound from the left column and move along the horizontal line to the US Dollar, the percentage change displayed in the box will represent GBP (base)/USD (quote).
Author

Akhtar Faruqui
FXStreet
Akhtar Faruqui is a Forex Analyst based in New Delhi, India. With a keen eye for market trends and a passion for dissecting complex financial dynamics, he is dedicated to delivering accurate and insightful Forex news and analysis.


