GBP/USD Price Forecast: Dips below 100-day SMA, sellers target 1.2900
- GBP/USD falls for the third consecutive day, trading below the 100-day SMA at 1.2962, with downside risks growing.
- Bearish RSI indicates further weakness, with key support at 1.2910-1.2920 and the 200-day SMA at 1.2799.
- A rebound could see a retest of the 1.3000 level, with next resistance at 1.3070 and the 50-day SMA at 1.3138.

The Pound Sterling extended its losses for the third straight day against the Greenback amid a scarce economic docket in the UK that will feature remarks of Bank of England (BoE) Governor Andrew Bailey. At the time of writing, the GBP/USD trades at 1.2954, down 0.22%.
GBP/USD Price Forecast: Technical outlook
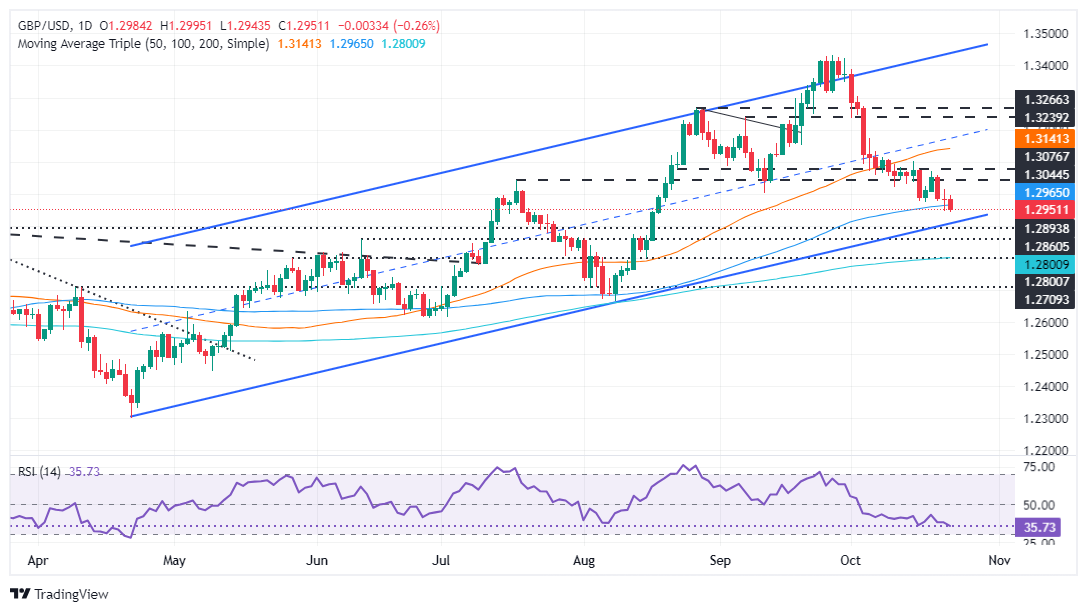
The GBP/USD has fallen below the 100-day simple moving average (SMA) at 1.2962, opening the door for further downside. Sellers are gathering some steam, as depicted by the Relative Strength Index (RSI).
The RSI is bearish and extending its downtrend yet shy of turning oversold. Hence, the GBP/USD could continue to edge lower.
If GBP/USD decisively breaks 1.2950, the next support would be the bottom trendline of an ascending channel at 1.2910-1.2920, followed by the 1.2900 mark. On further weakness, the next stop would be the 200-day SMA at 1.2799.
However, if GBP/USD rebounds at around the 100-day SMA, look for a retest of 1.3000. If buyers punch that level, the next resistance would be the October 18 peak at 1.3070, ahead of the 50-day SMA at 1.3138.
GBP/USD Price Chart – Daily
British Pound PRICE Today
The table below shows the percentage change of British Pound (GBP) against listed major currencies today. British Pound was the strongest against the Japanese Yen.
| USD | EUR | GBP | JPY | CAD | AUD | NZD | CHF | |
|---|---|---|---|---|---|---|---|---|
| USD | 0.26% | 0.26% | 1.29% | 0.25% | 0.69% | 0.57% | 0.18% | |
| EUR | -0.26% | 0.01% | 1.02% | 0.01% | 0.46% | 0.33% | -0.06% | |
| GBP | -0.26% | -0.01% | 1.01% | -0.02% | 0.45% | 0.32% | -0.02% | |
| JPY | -1.29% | -1.02% | -1.01% | -1.03% | -0.59% | -0.70% | -1.04% | |
| CAD | -0.25% | -0.01% | 0.02% | 1.03% | 0.44% | 0.34% | -0.01% | |
| AUD | -0.69% | -0.46% | -0.45% | 0.59% | -0.44% | -0.10% | -0.45% | |
| NZD | -0.57% | -0.33% | -0.32% | 0.70% | -0.34% | 0.10% | -0.35% | |
| CHF | -0.18% | 0.06% | 0.02% | 1.04% | 0.00% | 0.45% | 0.35% |
The heat map shows percentage changes of major currencies against each other. The base currency is picked from the left column, while the quote currency is picked from the top row. For example, if you pick the British Pound from the left column and move along the horizontal line to the US Dollar, the percentage change displayed in the box will represent GBP (base)/USD (quote).
Author

Christian Borjon Valencia
FXStreet
Markets analyst, news editor, and trading instructor with over 14 years of experience across FX, commodities, US equity indices, and global macro markets.


