GBP/USD Price Forecast: Clings to 1.3200 in sideways trading
- Exhaustion signals as GBP/USD stalls after a 400-pip rally, with RSI indicating overbought conditions.
- A daily close below 1.3200 could trigger a pullback, with support levels at 1.3130, 1.3100, and further down at 1.3043.
- If the pair breaks above 1.3230, resistance levels to watch are 1.3250 and the psychological 1.3300 mark.

The Pound Sterling begins the week on a positive note, yet remains hovering around the 1.3200 figure, unable to break last Friday new year-to-date (YTD) high of 1.3230, and trades at 1.3204 almost flat.
GBP/USD Price Forecast: Technical outlook
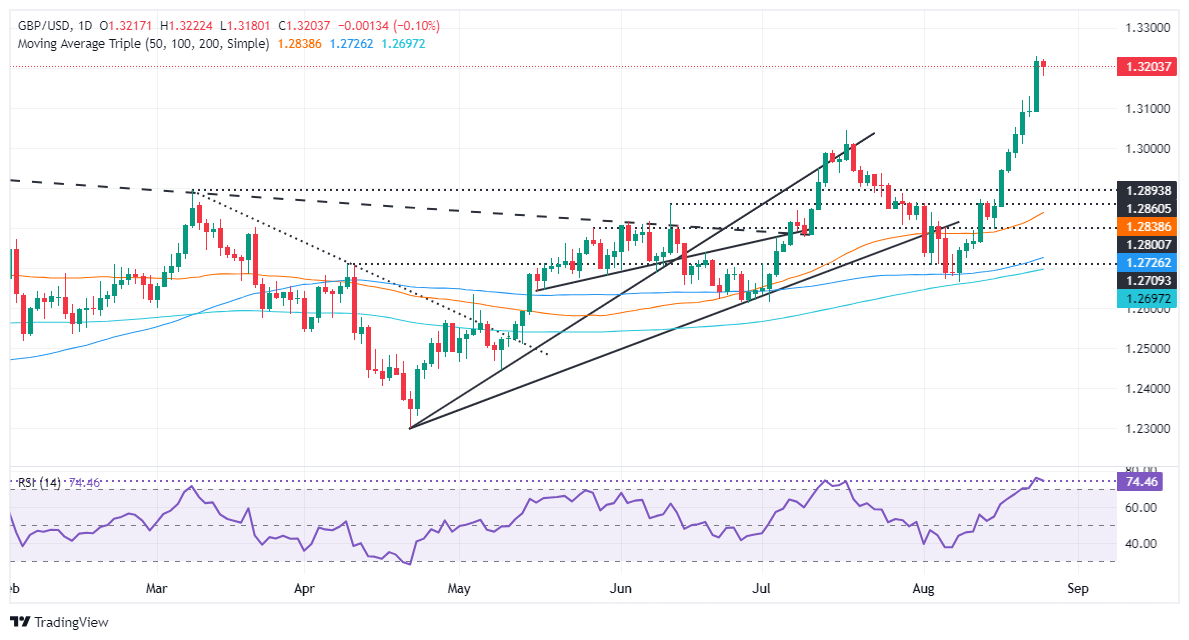
Exhaustion is the name of the game for the GBP/USD. After achieving a 400-pip run that started on August 15th, the pair has failed to extend its gains after hitting a multi-year peak at 1.3230. Today’s price action is forming a ‘doji,’ which indicates indecision amongst buyers and sellers.
Momentum shows buyers are losing steam as the Relative Strength Index (RSI) remains overbought. Therefore, if the GBP/USD achieves a daily close below 1.3200, that could pave the way for a deeper pullback.
In that outcome, the first support would be the August 22 high at 1.3130 before the pair slides to 1.3100. In further weakness, the GBP/USD might hit 1.3043, and July’s 17 daily high turned support.
On the other hand, if GBP/USD rises past 1.3230, the next resistance would be 1.3250, followed by the 1.3300 mark.
GBP/USD Price Action – Daily Chart
British Pound PRICE Today
The table below shows the percentage change of British Pound (GBP) against listed major currencies today. British Pound was the strongest against the New Zealand Dollar.
| USD | EUR | GBP | JPY | CAD | AUD | NZD | CHF | |
|---|---|---|---|---|---|---|---|---|
| USD | 0.12% | 0.09% | -0.04% | -0.32% | 0.22% | 0.21% | -0.14% | |
| EUR | -0.12% | -0.09% | -0.15% | -0.43% | 0.00% | 0.10% | -0.25% | |
| GBP | -0.09% | 0.09% | -0.17% | -0.40% | 0.09% | 0.13% | -0.22% | |
| JPY | 0.04% | 0.15% | 0.17% | -0.26% | 0.34% | 0.47% | -0.02% | |
| CAD | 0.32% | 0.43% | 0.40% | 0.26% | 0.53% | 0.59% | 0.17% | |
| AUD | -0.22% | -0.01% | -0.09% | -0.34% | -0.53% | 0.09% | -0.26% | |
| NZD | -0.21% | -0.10% | -0.13% | -0.47% | -0.59% | -0.09% | -0.36% | |
| CHF | 0.14% | 0.25% | 0.22% | 0.02% | -0.17% | 0.26% | 0.36% |
The heat map shows percentage changes of major currencies against each other. The base currency is picked from the left column, while the quote currency is picked from the top row. For example, if you pick the British Pound from the left column and move along the horizontal line to the US Dollar, the percentage change displayed in the box will represent GBP (base)/USD (quote).
Author

Christian Borjon Valencia
FXStreet
Markets analyst, news editor, and trading instructor with over 14 years of experience across FX, commodities, US equity indices, and global macro markets.


