|

GBP/USD Price Analysis: Tumbles below 1.2500 as bears cut bulls hopes short

  • GBP/USD registers a decline of 0.27%, influenced by US inflation data that suggests the Federal Reserve may delay rate cuts.
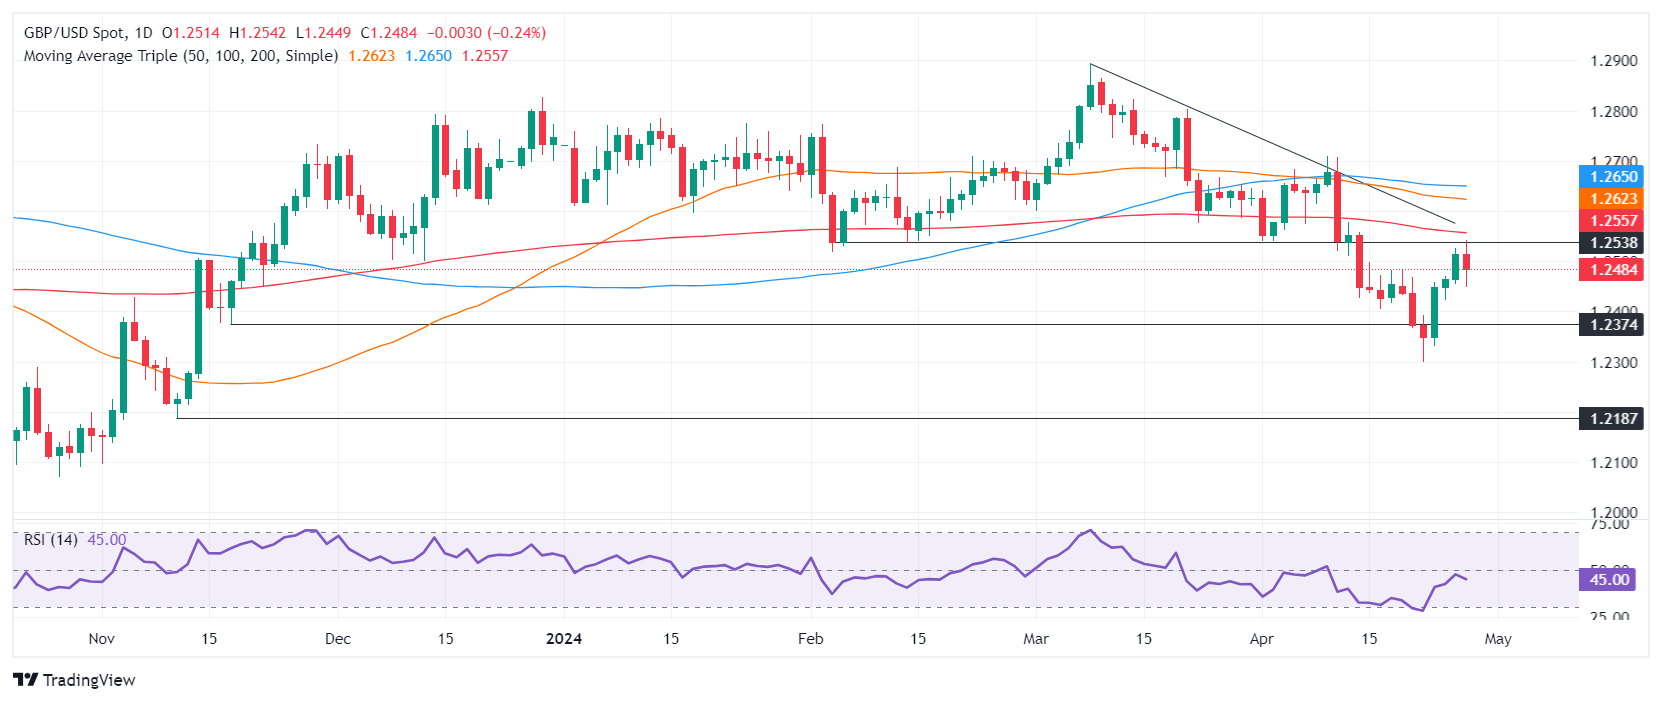
  • The pair's recent inability to break the 200-day moving average at 1.2557 highlights its downward bias, with support levels now in focus.
  • Potential for further losses if the 'dark cloud cover' candlestick pattern forms, targeting 1.2400 and possibly extending to the YTD low of 1.2300.

During the mid-North American session, the Pound Sterling retreats and registers losses against the US Dollar, slumping below 1.2500. Data from the United States showed that inflation is picking up, which would deter Fed intentions from cutting interest rates. The GBP/USD trades at 1.2481, down 027%.

GBP/USD Price Analysis: Technical outlook

Although the GBP/USD closed three days of consecutive gains, it remains downward biased, as buyers failed to crack stir resistance at the 200-day moving average (DMA) at 1.2557. That exposed the 1.2500 figure, which was surrendered by fundamental news.

If the GBP/USD finishes Friday’s session at around the 1.2480, that will form a ‘dark cloud cover,’ opening the door for further losses. The next support would be 1.2400, followed by the year-to-date (YTD) at 1.2300.

On the other hand, if buyers lift the spot price above 1.2500, that would open the door to challenge the 200-DMA.

GBP/USD Price Action – Daily Chart

GBP/USD

Overview
Today last price1.2481
Today Daily Change-0.0033
Today Daily Change %-0.26
Today daily open1.2514
 
Trends
Daily SMA201.2524
Daily SMA501.2626
Daily SMA1001.2651
Daily SMA2001.2559
 
Levels
Previous Daily High1.2527
Previous Daily Low1.2454
Previous Weekly High1.2499
Previous Weekly Low1.2367
Previous Monthly High1.2894
Previous Monthly Low1.2575
Daily Fibonacci 38.2%1.2499
Daily Fibonacci 61.8%1.2482
Daily Pivot Point S11.247
Daily Pivot Point S21.2426
Daily Pivot Point S31.2397
Daily Pivot Point R11.2542
Daily Pivot Point R21.2571
Daily Pivot Point R31.2614

Author

Christian Borjon Valencia

Markets analyst, news editor, and trading instructor with over 14 years of experience across FX, commodities, US equity indices, and global macro markets.

More from Christian Borjon Valencia
Share:

Editor's Picks

EUR/USD seems fragile below 1.1700 as Middle East war boosts energy prices

The EUR/USD pair trades flat at around 1.1680 during the Asian trading session on Tuesday, but broadly seems vulnerable, being close to its five-week low. The major currency pair is under pressure as surging oil prices due to the United States-Israel war with Iran have increased the risks of higher inflation for the Old Continent.

GBP/USD hovers around 1.3400 with bearish pressure intact

GBP/USD edges higher after three days of losses, trading around 1.3400 during the Asian hours on Tuesday. The technical analysis of the daily chart indicates an ongoing bearish bias, as the pair trades within a descending channel pattern.

Gold sticks to gains above $5,350 amid sustained safe-haven demand; firmer USD caps gains

Gold sticks to its positive bias for the third straight day and trades above the $5,350 level heading into the European session on Tuesday. Concerns about a broader regional conflict in the Middle East continue to weigh on investors' sentiment and underpin demand for the traditional safe-haven bullion.

Stellar risks deeper losses as derivatives metrics turn negative

Stellar is trading red below $0.16 at the time of writing on Tuesday, after a slight recovery the previous day. Weakening derivatives data caps the recovery, while an unfavorable technical outlook projects a deeper correction for the XLM token in the upcoming days.

The market is not panicking it is repricing the probability distribution of Oil and time

At the end of the day, markets do not trade morality or geopolitics. They trade transmission channels. And the only channel that truly matters in this maelstrom runs through the price of energy and the time value of money.

Grass 20% bullish breakout defies broader market weakness

Grass (GRASS) is edging up above $0.30 at the time of writing on Monday. The token’s notable 20% intraday surge stands out amid heightened volatility in the broader crypto market.