|

GBP/USD Price Analysis: The potential support level is located above 1.2700

  • GBP/USD struggles to gain ground around 1.2715 in Monday’s early European session. 
  • The pair keeps the negative vibe below the 100-period EMA, with bearish RSI indicator on the 4-hour chart. 
  • The first downside target is seen in the 1.2700–1.2701 zone; the next upside barrier is located at 1.2795. 

The GBP/USD pair trades in negative territory for the second consecutive day near 1.2715 during the early European session on Monday. The stronger US Dollar (USD) broadly drags the major pair lower. Investors await the UK Employment data on Tuesday for fresh impetus, including Claimant Count Change, Employment Change, and Average Earnings data. Any evidence of more layoffs in the UK economy might trigger the expectations of early rate cuts from the Bank of England (BoE) and might weigh on the Pound Sterling (GBP). 

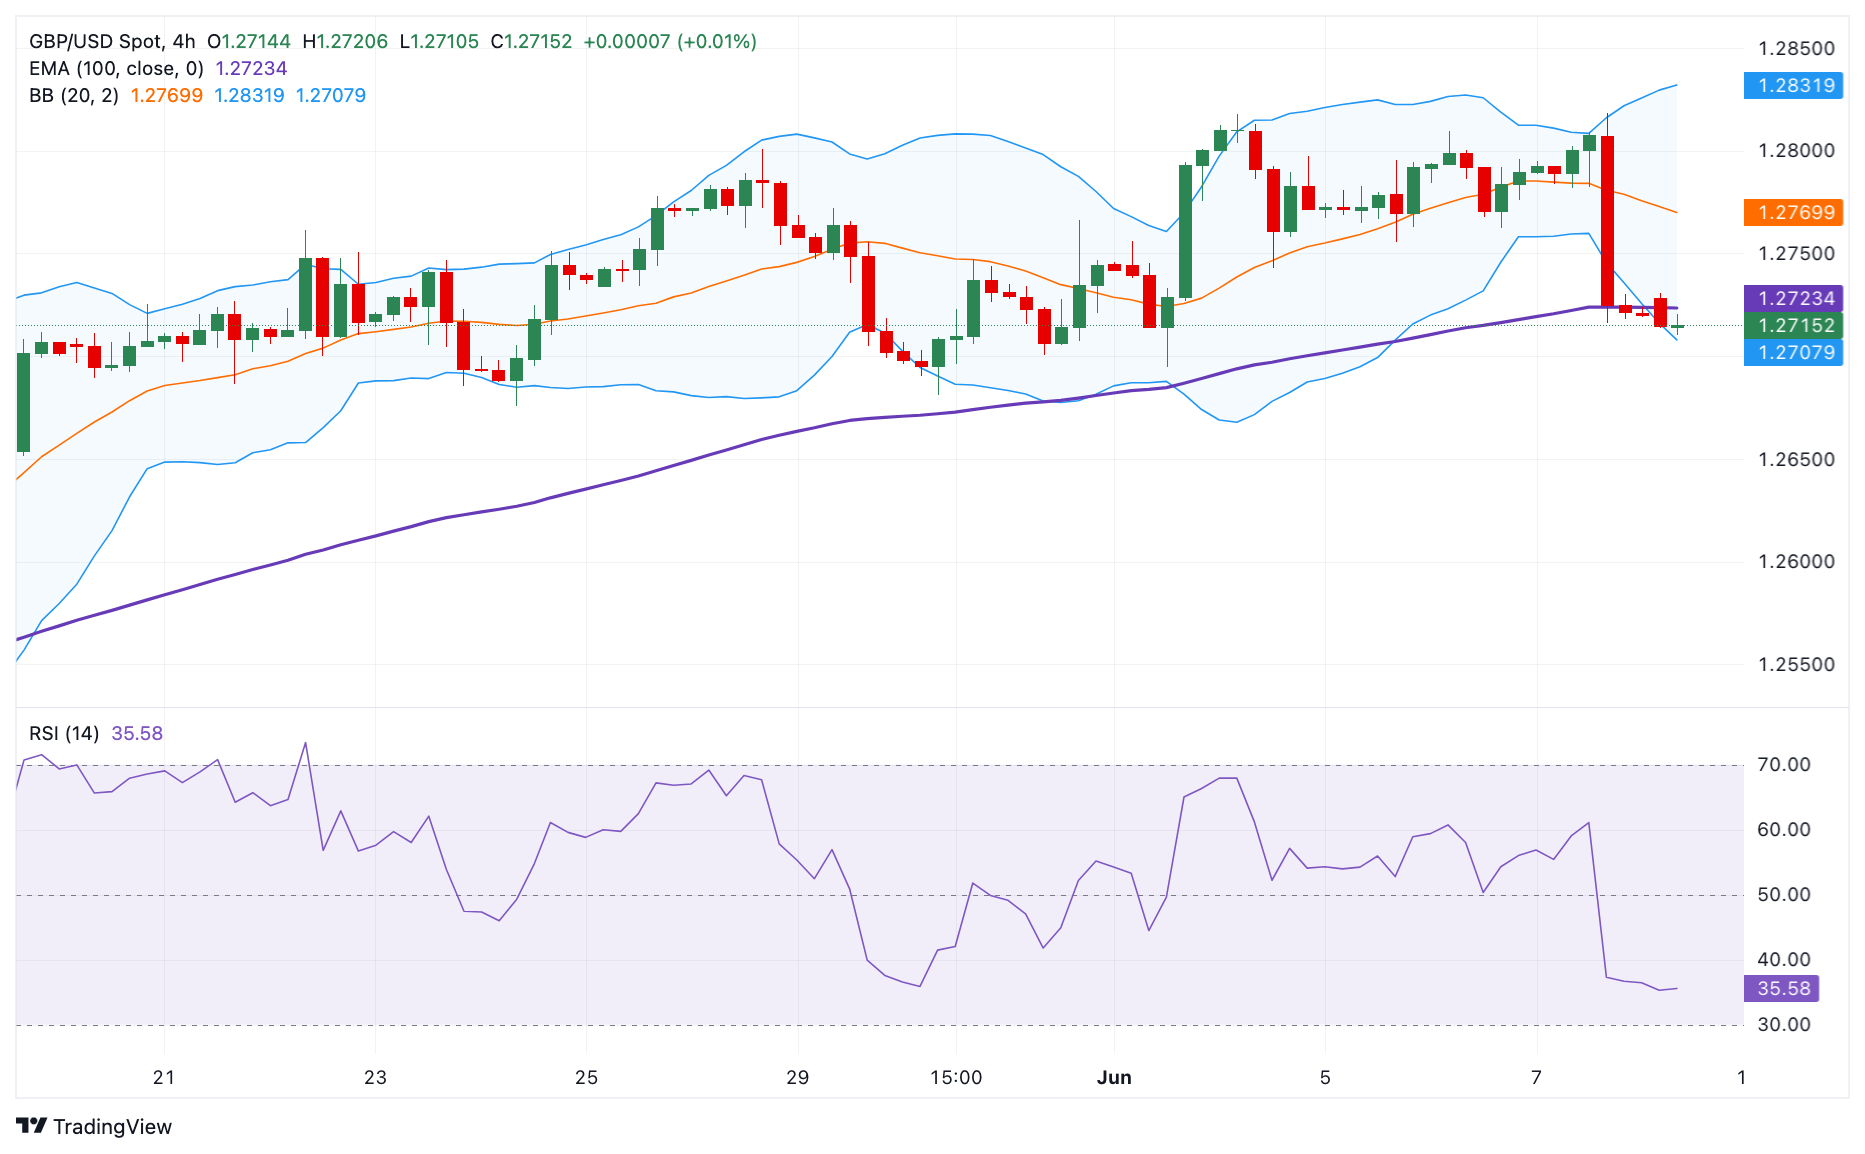
According to the 4-hour chart, the outlook of GBP/USD turns bearish as it holds below the key 100-period Exponential Moving Average (EMA). The downward momentum is supported by the Relative Strength Index (RSI), which stands around 37.00, indicating the path of least resistance is to the downside. 

A decisive break below the lower limit of the Bollinger Band and psychological level at the 1.2700-1.2710 region will pave the way to 1.2681, a low of May 30. Further south, the next contention level is seen at 1.2645, a low of May 17, followed by the 1.2600 round mark.  

The major pair should resume the upside if it crosses above the 100-period EMA at 1.2723. The next upside barrier for GBP/USD will emerge at 1.2795, a low of June 5. Any follow-through buying will expose 1.2809, a high of June 6, and finally the upper boundary of the Bollinger Band at 1.2831.  

GBP/USD 4-hour chart

GBP/USD

Overview
Today last price1.2716
Today Daily Change-0.0004
Today Daily Change %-0.03
Today daily open1.272
 
Trends
Daily SMA201.2718
Daily SMA501.26
Daily SMA1001.2638
Daily SMA2001.2545
 
Levels
Previous Daily High1.2818
Previous Daily Low1.2716
Previous Weekly High1.2818
Previous Weekly Low1.2695
Previous Monthly High1.2801
Previous Monthly Low1.2446
Daily Fibonacci 38.2%1.2755
Daily Fibonacci 61.8%1.2779
Daily Pivot Point S11.2685
Daily Pivot Point S21.2649
Daily Pivot Point S31.2583
Daily Pivot Point R11.2787
Daily Pivot Point R21.2853
Daily Pivot Point R31.2889

Author

Lallalit Srijandorn

Lallalit Srijandorn is a Parisian at heart. She has lived in France since 2019 and now becomes a digital entrepreneur based in Paris and Bangkok.

More from Lallalit Srijandorn
Share:

Markets move fast. We move first.

Orange Juice Newsletter brings you expert driven insights - not headlines. Every day on your inbox.

By subscribing you agree to our Terms and conditions.

Editor's Picks

EUR/USD moves sideways below 1.1800 on Christmas Eve

EUR/USD struggles to find direction and trades in a narrow channel below 1.1800 after posting gains for two consecutive days. Bond and stock markets in the US will open at the usual time and close early on Christmas Eve, allowing the trading action to remain subdued. 

GBP/USD keeps range around 1.3500 amid quiet markets

GBP/USD keeps its range trade intact at around 1.3500 on Wednesday. The Pound Sterling holds the upper hand over the US Dollar amid pre-Christmas light trading as traders move to the sidelines heading into the holiday season. 

Gold retreats from record highs, trades below $4,500

Gold retreats after setting a new record-high above $4,520 earlier in the day and trades in a tight range below $4,500 as trading volumes thin out ahead of the Christmas break. The US Dollar selling bias remains unabated on the back of dovish Fed expectations, which continues to act as a tailwind for the bullion amid persistent geopolitical risks.

Bitcoin slips below $87,000 as ETF outflows intensify, whale participation declines

Bitcoin price continues to trade around $86,770 on Wednesday, after failing to break above the $90,000 resistance. US-listed spot ETFs record an outflow of $188.64 million on Tuesday, marking the fourth consecutive day of withdrawals.

Economic outlook 2026-2027 in advanced countries: Solidity test

After a year marked by global economic resilience and ending on a note of optimism, 2026 looks promising and could be a year of solid economic performance. In our baseline scenario, we expect most of the supportive factors at work in 2025 to continue to play a role in 2026.

Avalanche struggles near $12 as Grayscale files updated form for ETF

Avalanche trades close to $12 by press time on Wednesday, extending the nearly 2% drop from the previous day. Grayscale filed an updated form to convert its Avalanche-focused Trust into an ETF with the US Securities and Exchange Commission.