|

GBP/USD Price Analysis: Testing breakout of a rising channel pattern below 1.2550

  • GBP/USD is showing signs of exhaustion in the upside momentum after failing to extend the upside above 1.2583.
  • The risk profile is favoring risk-sensitive assets amid solid quarterly performance from US tech-savvy stocks.
  • GBP/USD has delivered a breakout of the Rising Channel chart pattern and is testing it with a minor correction to near 1.2546.

The GBP/USD pair is showing signs of exhaustion in the upside momentum after failing to extend the upside above 1.2583. The Cable has turned sideways around 1.2560 as investors are preparing for monetary policy by the Federal Reserve (Fed), which is scheduled for Wednesday.

The risk profile is favoring risk-sensitive assets as S&P500 futures are having minimal gains after a bullish Friday. Investors were gung-ho for United States equities after a solid quarterly performance from tech-savvy stocks.

The US Dollar Index (DXY) is eyeing a further stretch in recovery above 101.80 as the Fed is expected to raise interest rates further to tame sticky core inflation. US Consumer spending is resilient amid higher outlays for services.

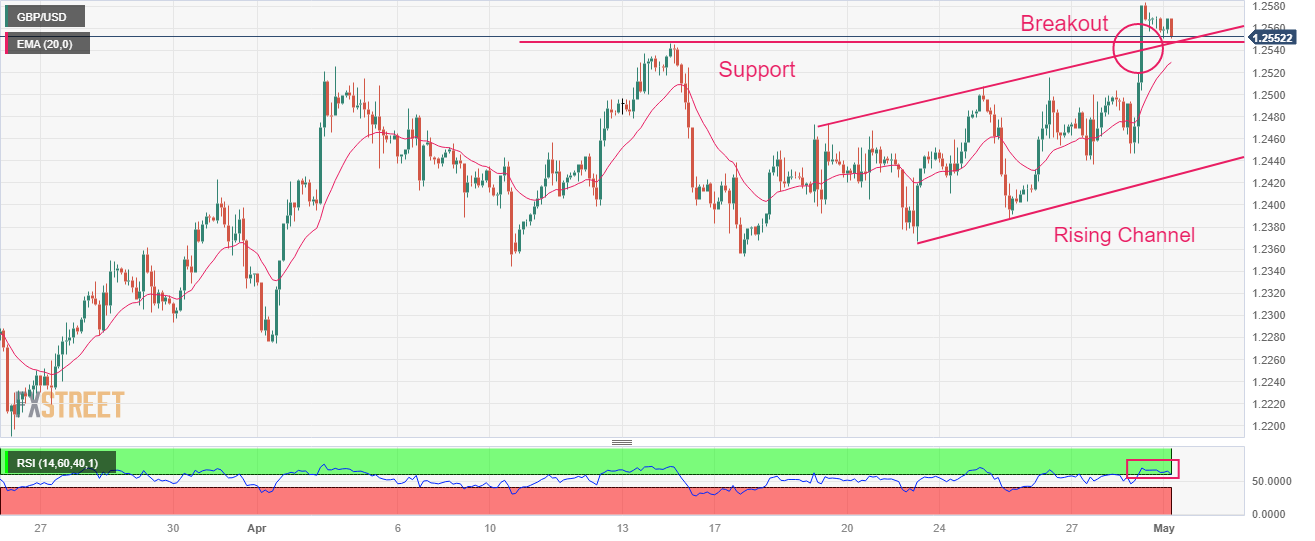
GBP/USD has delivered a breakout of the Rising Channel chart pattern on a two-hour scale. An upside break of the Rising Channel chart pattern indicates sheer strength in the Pound Sterling. The immediate support is plotted from April 14 high at 1.2546.

Advancing 20-period Exponential Moving Average (EMA) at 1.2530 indicates more upside ahead.

Also, the Relative Strength Index (RSI) (14) has shifted into the bullish range of 60.00-80.00, hinting that the upside momentum is active for now.

A successful test of breakout near April 14 high at 1.2546 will drive the asset towards a fresh 10-month high at 1.2597, which is 08 June 2022 high. A breach of the latter will expose the asset to May 27 high at 1.2667.

On the flip side, a slippage below April 10 low at 1.2345 will expose the asset to March 30 low at 1.2294 followed by March 27 low at 1.2219.

GBP/USD two-hour chart

GBP/USD

Overview
Today last price
1.255
Today Daily Change
-0.0019
Today Daily Change %
-0.15
Today daily open
1.2569
 
Trends
Daily SMA20
1.2451
Daily SMA50
1.2251
Daily SMA100
1.2212
Daily SMA200
1.194
 
Levels
Previous Daily High
1.2584
Previous Daily Low
1.2446
Previous Weekly High
1.2584
Previous Weekly Low
1.2387
Previous Monthly High
1.2584
Previous Monthly Low
1.2275
Daily Fibonacci 38.2%
1.2531
Daily Fibonacci 61.8%
1.2499
Daily Pivot Point S1
1.2482
Daily Pivot Point S2
1.2396
Daily Pivot Point S3
1.2345
Daily Pivot Point R1
1.262
Daily Pivot Point R2
1.267
Daily Pivot Point R3
1.2757

Author

Sagar Dua

Sagar Dua

FXStreet

Sagar Dua is associated with the financial markets from his college days. Along with pursuing post-graduation in Commerce in 2014, he started his markets training with chart analysis.

More from Sagar Dua
Share:

Editor's Picks

EUR/USD attempts some consolidation near 1.1750

EUR/USD is staying firmly supported and hovering near two-day highs around 1.1750 on Thursday, shaking off the mild pullback seen a day earlier. The pair is benefiting from a friendlier risk backdrop, underpinned by easing EU–US trade tensions and a softer Greenback. Moving forward, markets’ attention will be on the release of flash PMIs in Europe and the US on Friday.

GBP/USD challenges two-week highs near 1.3500

GBP/USD is picking up fresh momentum and confronting two-week tops near the 1.3500 yardstick on Thursday. In doing so, Cable is brushing off Wednesday’s brief stumble and getting back on its upward track, supported by continued selling pressure on the Greenback.

Gold resumes rally, aims for $4,900 in the near term

Gold is extending its rally on Thursday, approaching the area of record highs near $4,880 per troy ounce as the US Dollar pulls back. The move comes even as global risk appetite improves, after President Trump reversed course on Greenland, helping to ease broader geopolitical tensions.

Crypto Today: Bitcoin, Ethereum, XRP post modest gains as ETF selling pressure intensifies

Bitcoin rises marginally above $90,000, but intense ETF selling pressure continues to weigh on the asset. Ethereum trades around $3,000 amid broader crypto market volatility and waning institutional interest. XRP ticks up for the second consecutive day despite subdued retail demand.

Trump walks back NATO tariffs, signals de-escalation

What began as a sharp escalation risk quickly turned into a de-escalation signal. Earlier this week, markets briefly priced in escalation risk after Donald J. Trump proposed a 10% tariff hike on eight NATO nations amid the Greenland dispute.

XRP defends $1.90 support as ETFs attract inflows despite retail caution

Ripple (XRP) is consolidating above $1.90, a short-term support level, at the time of writing on Thursday. This mild uptick marks two consecutive days of a strengthening technical outlook, following recent market-wide volatility.