|

GBP/USD Price Analysis: Teases bearish cross below 1.3800

  • GBP/USD remains sidelined after a sluggish start to the week.
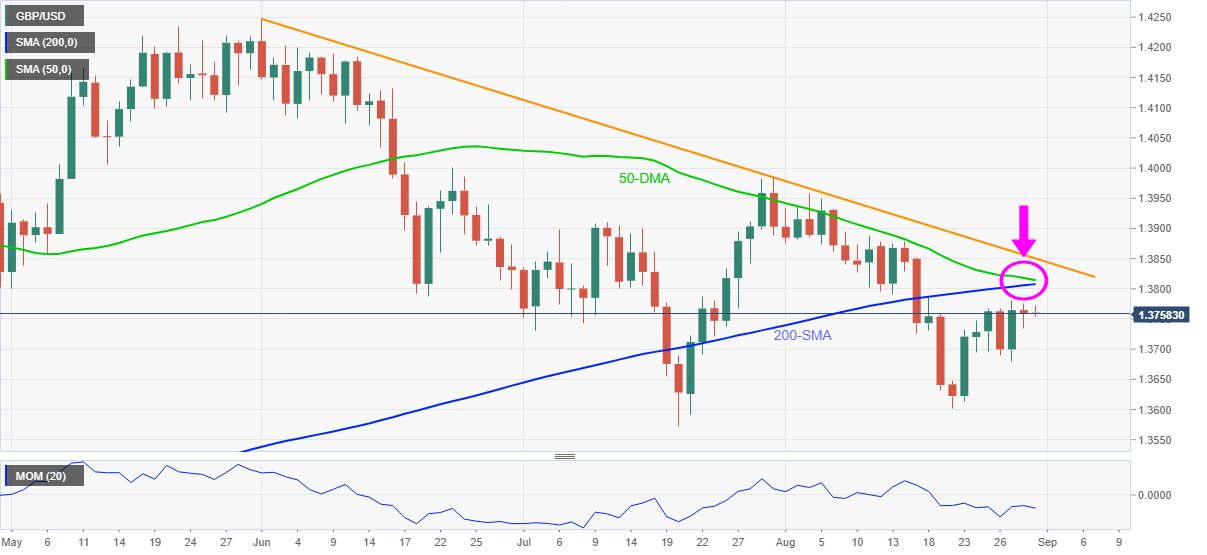
  • Downbeat Momentum line backs 50-DMA crossing under 200-DMA and suggesting further downside.
  • Three-month-old descending trend line adds to the upside filters.

GBP/USD keeps the week-start inactivity around the mid 1.3700s during Tuesday’s Asian session. Even so, bears remain hopeful as the Daily Moving Averages (DMAs) hint at a bearish cross as the prices remain below an important resistance line stretched from June 01.

It’s worth noting that a descending Momentum line also backs the GBP/USD sellers who await a daily closing below the 1.3700 threshold to confirm the pair’s further weakness.

Given the quote’s downside past 1.3700, the 50-DMA will drop below 200-DMA and suggest the pair’s further declines towards the monthly low near 1.3600. However, any further downside will be challenged by a seven-month-old horizontal support area surrounding 1.3570-65.

Meanwhile, the 1.3800 round figure can entertain GBP/USD buyers during fresh upside. Though, the stated DMAs near 1.3810-15 may challenge the pair’s upside afterward.

Even if the quote rises past 1.3815, the multi-day-old resistance line near 1.3850 will be a tough nut to crack for the buyers ahead of targeting the late July tops near 1.3985.

GBP/USD: Daily chart

Trend: Further weakness expected

Additional important levels

Overview
Today last price1.3758
Today Daily Change-0.0007
Today Daily Change %-0.05%
Today daily open1.3765
 
Trends
Daily SMA201.38
Daily SMA501.3821
Daily SMA1001.3921
Daily SMA2001.3804
 
Levels
Previous Daily High1.3781
Previous Daily Low1.368
Previous Weekly High1.3781
Previous Weekly Low1.3612
Previous Monthly High1.3984
Previous Monthly Low1.3572
Daily Fibonacci 38.2%1.3743
Daily Fibonacci 61.8%1.3719
Daily Pivot Point S11.3703
Daily Pivot Point S21.3641
Daily Pivot Point S31.3602
Daily Pivot Point R11.3804
Daily Pivot Point R21.3843
Daily Pivot Point R31.3905

Author

Anil Panchal

Anil Panchal

FXStreet

Anil Panchal has nearly 15 years of experience in tracking financial markets. With a keen interest in macroeconomics, Anil aptly tracks global news/updates and stays well-informed about the global financial moves and their implications.

More from Anil Panchal
Share:

Editor's Picks

EUR/USD holds above 1.1750 after mixed EU PMI data

EUR/USD manages to hold above 1.1750 but struggles to gather recovery momentum on Friday, following the mixed February PMI figures from Germany and the Eurozone. In the second half of the day, Q4 GDP, December inflation and February PMI data from the US will be watched closely by market participants.

GBP/USD recovers further toward 1.3500 after UK PMI data

GBP/USD is recovering ground further toward 1.3500 in European trading on Friday, helped by a modest uptick in the Pound Sterling after stronger-than-expected UK January Retail Sales and February PMI data. However, the pair's further upside could be limited amid persistent US Dollar strength as the focus turns to key US data. 

Gold sticks to positive bias above $5,000 ahead of US data

Gold gains some positive traction for the third consecutive day on Friday. holding above $5,000. Traders now look forward to the key US macro releases – the Advance Q4 GDP report and the Personal Consumption Expenditures (PCE) Price Index – for fresh trading impetus. 

US GDP growth expected to slow down significantly in Q4 after stellar Q3 

The United States Bureau of Economic Analysis will publish the first preliminary estimate of the fourth-quarter Gross Domestic Product at 13:30 GMT. Analysts forecast the US economy to have expanded at a 3% annualized rate, slowing down from the 4.4% growth posted in the previous quarter.

Iran tensions and AI fears at the forefront ahead of key US data

Thursday’s scorecard shows major US Stock benchmarks closed modestly in the red amid mounting US-Iran tensions and AI disruption worries. The S&P 500 shed 19 points (0.3%) to 6,861, the Nasdaq 100 lost 101 points (0.4%) to 24,797, and the Dow Jones Industrial Average dropped 267 points (0.5%) to 49,395.

Official Trump price approaches breakout with mixed signals from traders

Official Trump (TRUMP) is trading at $3.50 at the time of writing, approaching its upper consolidation range. A breakout from this range could open the door for an upside move. On-chain data shows market indecision, with balanced flows between bulls and bears, signaling a lack of clear directional bias.