|

GBP/USD Price Analysis: Struggles to remain above 1.2800, falls

  • GBP/USD snaps three days of gains, drops below 1.2800.
  • The pair remains consolidated yet lacks the strength to rally towards the YTD high.
  • Momentum favors sellers, but they must push GBP/USD below 1.2700.

The GBP/USD experienced a retreat early in the North American session, down by 0.23%. This was a continuation of a trend, as the major trades below 1.2800 at around 1.2769 were unable to achieve a daily close above 1.2800 for the ninth consecutive trading day.

GBP/USD Price Analysis: Technical outlook

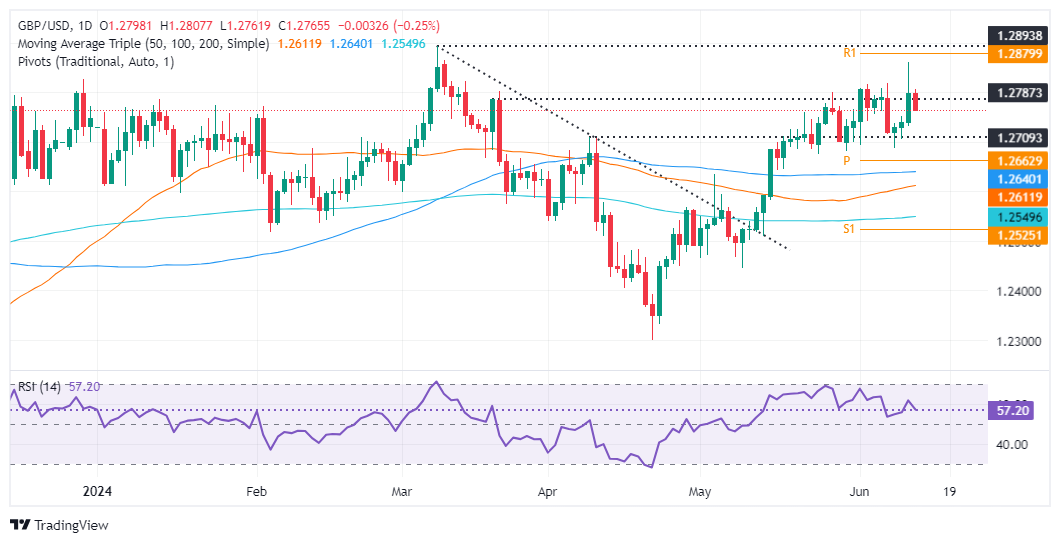
Despite reaching a three-month high, the GBP/USD remains consolidated, with buyers unable to push the exchange rate above the 1.2800 figure to challenge the year-to-date (YTD) high of 1.2894.

Momentum has shifted, and sellers appear to gather traction, yet the Relative Strength Index (RSI) remains in bullish territory but is dropping towards the 50-midline. Once the RSI pierces the latter, that would be the green light to drive the GBP/USD lower.

Key support levels lie ahead, like the latest cycle low of 1.2687, the June 10 low. A breach of the latter will pave the way toward the confluence of the 100-day moving average (DMA) and the May 16 low of 1.2643 before challenging the 50-DMA at 1.2610.

GBP/USD Price Action – Daily Chart

GBP/USD

Overview
Today last price1.2771
Today Daily Change-0.0027
Today Daily Change %-0.21
Today daily open1.2798
 
Trends
Daily SMA201.274
Daily SMA501.2609
Daily SMA1001.2639
Daily SMA2001.2548
 
Levels
Previous Daily High1.286
Previous Daily Low1.2733
Previous Weekly High1.2818
Previous Weekly Low1.2695
Previous Monthly High1.2801
Previous Monthly Low1.2446
Daily Fibonacci 38.2%1.2812
Daily Fibonacci 61.8%1.2782
Daily Pivot Point S11.2734
Daily Pivot Point S21.267
Daily Pivot Point S31.2606
Daily Pivot Point R11.2861
Daily Pivot Point R21.2925
Daily Pivot Point R31.2989

Author

Christian Borjon Valencia

Markets analyst, news editor, and trading instructor with over 14 years of experience across FX, commodities, US equity indices, and global macro markets.

More from Christian Borjon Valencia
Share:

Editor's Picks

AUD/USD eyes 0.7150 barrier nine-day EMA

AUD/USD inches higher after registering modest losses in the previous day, trading around 0.7130 during the Asian hours. The technical analysis of the daily chart indicates that the pair is moving sideways within the rectangle pattern, suggesting a consolidation as neither the bulls nor the bears have enough momentum to take control of the market.

USD/JPY trades below 160.00 intervention threshold; bullish bias intact

The USD/JPY pair attracts some sellers during the Asian session amid fears that authorities will step in again to prop up the Japanese Yen. Furthermore, the Israel-Lebanon truce prompts some profit-taking around the US Dollar and exerts downward pressure on the currency pair.

Gold extends rebound to $4,500 as US yields edge lower

Gold (XAU/USD) preserves its recovery momentum following Wednesday's slide and tests the $4,500 mark in the second half of the day on Thursday. While US-Iran uncertainty remains, easing tensions between Lebanon on Israel seems to be helping the market mood improve, causing the USD to lose strength alongside falling US T-bond yields and opening the door for a decisive rebound in XAU/USD.

Bitcoin’s massive storm is back: Why the sell-off is far from over

Bitcoin price action over the last few weeks has felt less like a normal, healthy correction and more like a slow grinding crash that continues to wreak havoc on holdings and trading accounts. And everything suggests that the dramatic crash isn’t over.

Nonfarm payrolls: Testing the limits of Fed policy patience

The upcoming nonfarm payrolls report for May will provide the final update on the US labor market before Kevin Warsh attends his first policy meeting as the new Fed Chair later this month.

Recession on paper: What really moves the Canadian Loonie now?

Statistics Canada handed the headline writers a gift and the analysts a headache. Real GDP shrank 0.1% on an annualized basis in the first quarter, and with the fourth quarter of 2025 revised down to a 1.0% contraction, that is two negative quarters in a row, the textbook definition of a technical recession and Canada's first since the pandemic.