- GBP/USD pukes following stellar US NFP data report.
- The pair trades at around weekly lows, sellers eye 1.2694.
- Near-term momentum favors sellers, as RSI accelerates toward the 50-midline.
The British Pound plunged against the US Dollar after the US Bureau of Labor Statistics (BLS) revealed the US jobs market remains hotter than expected, exceeding the consensus estimates, boosting the Greenback. Therefore, the pair tumbled near the week's lows, with the GBP/USD trading at 1.2722, down 0.53%, at the time of writing.
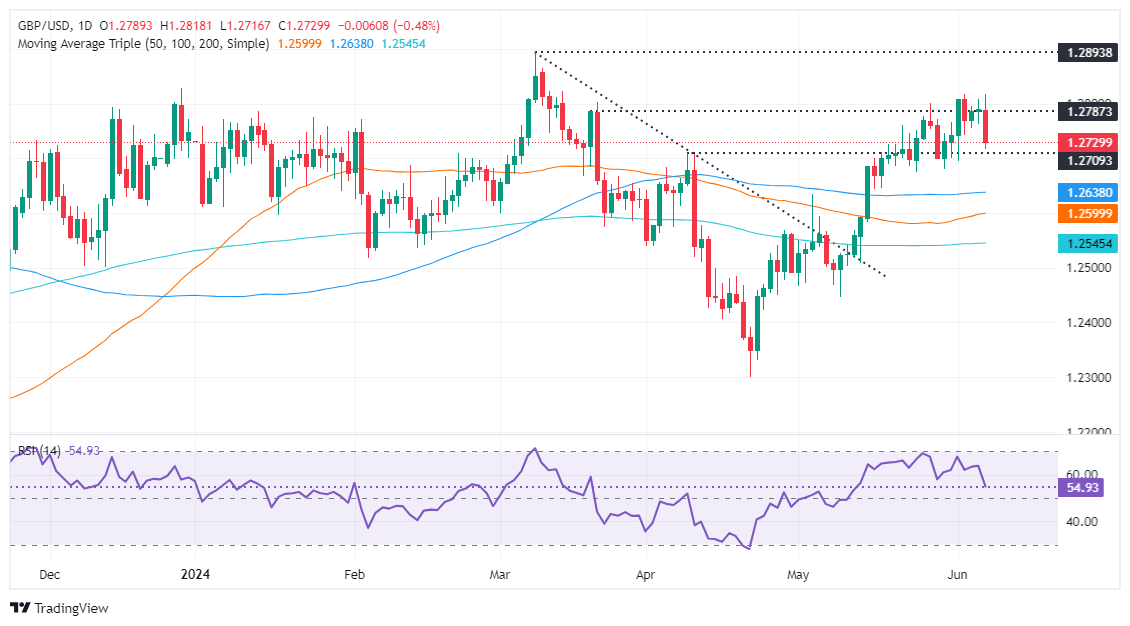
GBP/USD Price Analysis: Technical outlook
From a technical perspective, the GBP/USD failed to clear strong resistance at the confluence of technical indicators, and sudden US Dollar strength dragged the spot prices below the low of the three-day range of 1.2740.
Momentum has shifted in sellers’ favor in the near term, with the Relative Strength Index (RSI) diving from around 64 to 54.26, about to enter bearish territory.
That said, the first support for GBP/USD would be the 1.2700 figure, followed by last Friday’s low of 1.2694. Further losses are seen beneath at 1.2680, the May 30 low, immediately followed by the May 24 cycle low of 1.2674.
Conversely, if buyers reclaim 1.2740, that could pave the way to keep the pair range-bound at around 1.2750-1.2800.
GBP/USD Price Action – Daily Chart
British Pound PRICE Today
The table below shows the percentage change of British Pound (GBP) against listed major currencies today. British Pound was the strongest against the New Zealand Dollar.
USD | EUR | GBP | JPY | CAD | AUD | NZD | CHF | |
---|---|---|---|---|---|---|---|---|
USD | 0.67% | 0.47% | 0.80% | 0.43% | 1.10% | 1.28% | 0.87% | |
EUR | -0.67% | -0.18% | 0.14% | -0.24% | 0.43% | 0.66% | 0.20% | |
GBP | -0.47% | 0.18% | 0.32% | -0.06% | 0.62% | 0.84% | 0.38% | |
JPY | -0.80% | -0.14% | -0.32% | -0.37% | 0.29% | 0.48% | 0.08% | |
CAD | -0.43% | 0.24% | 0.06% | 0.37% | 0.67% | 0.91% | 0.44% | |
AUD | -1.10% | -0.43% | -0.62% | -0.29% | -0.67% | 0.22% | -0.25% | |
NZD | -1.28% | -0.66% | -0.84% | -0.48% | -0.91% | -0.22% | -0.45% | |
CHF | -0.87% | -0.20% | -0.38% | -0.08% | -0.44% | 0.25% | 0.45% |
The heat map shows percentage changes of major currencies against each other. The base currency is picked from the left column, while the quote currency is picked from the top row. For example, if you pick the British Pound from the left column and move along the horizontal line to the US Dollar, the percentage change displayed in the box will represent GBP (base)/USD (quote).
Information on these pages contains forward-looking statements that involve risks and uncertainties. Markets and instruments profiled on this page are for informational purposes only and should not in any way come across as a recommendation to buy or sell in these assets. You should do your own thorough research before making any investment decisions. FXStreet does not in any way guarantee that this information is free from mistakes, errors, or material misstatements. It also does not guarantee that this information is of a timely nature. Investing in Open Markets involves a great deal of risk, including the loss of all or a portion of your investment, as well as emotional distress. All risks, losses and costs associated with investing, including total loss of principal, are your responsibility. The views and opinions expressed in this article are those of the authors and do not necessarily reflect the official policy or position of FXStreet nor its advertisers. The author will not be held responsible for information that is found at the end of links posted on this page.
If not otherwise explicitly mentioned in the body of the article, at the time of writing, the author has no position in any stock mentioned in this article and no business relationship with any company mentioned. The author has not received compensation for writing this article, other than from FXStreet.
FXStreet and the author do not provide personalized recommendations. The author makes no representations as to the accuracy, completeness, or suitability of this information. FXStreet and the author will not be liable for any errors, omissions or any losses, injuries or damages arising from this information and its display or use. Errors and omissions excepted.
The author and FXStreet are not registered investment advisors and nothing in this article is intended to be investment advice.
Recommended content
Editors’ Picks

AUD/USD keeps range near 0.6500 after Australian CPI data
AUD/USD keeps wavering near 0.6500 in Wednesday's Asian trading. The Aussie faces headwinds from softer Australian CPI inflation data for May, which fans RBA rate cut expectations. A softer US Dollar, however, lends support to the pair despite a cautious market mood.

USD/JPY stalls the rebound below 145.00 after Japan's PPI, BoJ commentary
USD/JPY stalls the bounce below 145.00 following strong Japanese Services PPI data, which supports the case for more BoJ rate hikes and the Japanese Yen, despite the mixed BoJ's June Summary of Opinions. Meanwhile, the US Dollar's downside bias also keeps the pair on the defensive.

Gold defends 50-day SMA, but for how long?
Gold price is building on its previous rebound early Wednesday, snapping a three-day bearish streak as the US Dollar rebound fizzles ahead of day 2 of Federal Reserve Chair Jerome Powell’s congressional testimony and mid-tier US data.

SEI, SYRUP, APT eye further gains as investors focus on Made in America tokens
Sei extends the weekly run on Wednesday, hitting a new two-month high. Maple Finance records a new all-time high, nearing a channel breakout. Aptos ticks lower after two days of recovery, bouncing off the lower boundary of a falling channel.

Could Iran block the Strait of Hormuz? Why Oil is on edge after US strikes
As the Israel-Iran conflict reaches new heights, an old threat is coming back to haunt the markets: that of the closure of the Strait of Hormuz. This narrow arm of the sea in the Persian Gulf, wedged between Iran to the north and the United Arab Emirates and Oman to the south, is much more than a simple sea passage.

The Best brokers to trade EUR/USD
SPONSORED Discover the top brokers for trading EUR/USD in 2025. Our list features brokers with competitive spreads, fast execution, and powerful platforms. Whether you're a beginner or an expert, find the right partner to navigate the dynamic Forex market.